
Why Interdisciplinary Capstones Matter (And Why You Should Care)
Capstone projects are the thrilling final chapter of a learning journey: they ask you to synthesize knowledge, design something meaningful, and communicate impact. But the single most powerful twist you can give to a capstone is interdisciplinarity—mixing STEM with the Arts, or Social Sciences with Data. Why? Because the most interesting real-world problems don’t come in neatly labeled boxes. They demand technical reasoning, creative design, and human-centered insight all at once. This blog is a friendly, practical guide for AP students (and anyone tackling a capstone) who want project ideas, structure, and concrete tools to create work that matters.
How To Read This Guide
This piece lays out:
- High-potential project prompts that blend STEM + Arts or Social Science + Data.
- Practical steps to plan, research, build, and present your capstone.
- Evaluation rubrics and sample timelines to keep you on track.
- Examples of tools and creative techniques to make your work stand out.
Sprinkled throughout are realistic classroom-ready examples, and where it fits naturally, notes on how Sparkl’s personalized tutoring can help with 1-on-1 guidance, tailored study plans, expert tutors, and AI-driven insights.
Project Categories: Choosing the Right Interdisciplinary Angle
Below are four approachable categories you can pick from depending on your strengths and interests. Each category includes distinct capstone prompts and a short explanation of why that mix is valuable.
1. STEM + Visual Arts: Data-Inspired Design
Why it works: Visual arts translate data, patterns, and structures into human-scale meaning. When STEM provides structure—algorithms, models, measurements—and art provides interpretation, the result is both informative and emotionally resonant.
- Prompt A: Create a data-driven mural or series of prints that visualize local environmental data (air quality, noise, temperature) using generative algorithms.
- Prompt B: Build an interactive sculpture that reacts to sensor input (light, humidity, proximity) and documents the engineering design process.
- Prompt C: Design an infographic series and a short animated video that explain a complex STEM concept (e.g., CRISPR, machine learning basics) for a general audience.

2. STEM + Performing Arts: Human-Centered Technology
Why it works: Performing arts help you prototype experiences—sound, movement, timing—that reveal how people interact with technology. This is a great route for showing empathy and usability alongside technical achievement.
- Prompt A: Compose and code a piece where sensors on performers alter live soundscapes—document the circuit design, signal processing, and rehearsal outcomes.
- Prompt B: Create an AR (augmented reality) stage design that augments props or choreography with real-time computed visuals.
3. Social Science + Data: Policy, People, and Evidence
Why it works: Social science asks ‘why’ and ‘what it means.’ Data adds rigor. Together they allow you to test hypotheses about communities, behavior, or policy with quantitative and qualitative methods.
- Prompt A: Analyze local transit usage and equity by combining rider surveys, open transit data, and demographic maps; recommend three policy changes and model projected impact.
- Prompt B: Evaluate the relationship between social media patterns and youth mental health in your school—conduct surveys, sentiment analysis, and present insights with ethical considerations.
4. Arts + Social Science + Data: Cultural Storytelling with Evidence
Why it works: This triad amplifies community narratives while anchoring them in evidence. The best capstones in this space feel like public humanities—research with heart and numbers that back up claims.
- Prompt A: Produce a short documentary that uses oral histories and mapped archival data to tell a neighborhood’s story across decades.
- Prompt B: Curate a multimedia exhibition (physical or virtual) that explores migration patterns through personal artifacts and interactive data visualizations.
From Idea to Impact: Concrete Steps for Your Capstone
Let’s turn an idea into a manageable project. Below is a step-by-step workflow that works whether your capstone is a coded app, an art installation, or a mixed-methods social inquiry.
Step 1 — Define a Clear Research Question or Design Goal
Frame your project with a short, crisp question. Examples:
- “How can sensor-driven installation increase public awareness of urban heat islands?”
- “Does a school-based mindfulness app improve attention among freshmen?”
- “What does historical zoning data tell us about current access to green space?”
Pro tip: A tightly scoped question saves time and makes evaluation straightforward.
Step 2 — Pick Methods and Deliverables
Decide what counts as evidence. Mix methods for depth:
- Quantitative: datasets, experiments, statistical models, code repositories.
- Qualitative: interviews, focus groups, reflective journals, creative artifacts.
- Design artifacts: prototypes, installations, animations, performances.
Step 3 — Plan A Realistic Timeline
Capstones often fail not for lack of ambition but for lack of pacing. Below is a sample timeline for a one-semester project. Adjust if you have longer.
| Week Range | Focus | Typical Deliverables |
|---|---|---|
| Weeks 1–2 | Refine question & literature scan | Project brief, annotated sources |
| Weeks 3–5 | Methods design & prototyping | Prototype, research instruments (surveys, interview guides) |
| Weeks 6–9 | Data collection / development | Datasets, code, recordings |
| Weeks 10–12 | Analysis, iteration, creation | Draft visualizations, refined prototypes |
| Weeks 13–15 | Finalize deliverables & presentation | Report, exhibit, performance, poster |
Step 4 — Build Ethical Guardrails
Especially with Social Science + Data, ethics matter. Decide early how you’ll handle consent, anonymization, and representation. If you’re working with people, create an IRB-like checklist: informed consent forms, data storage plans, and a debrief protocol.
Tools and Techniques That Make Interdisciplinary Work Practical
You don’t need to be a specialist to use power tools—just pick ones that match your scope and learning goals.
For Data Collection and Analysis
- Google Sheets or Excel for quick cleaning and descriptive stats.
- Python (pandas, matplotlib) or R (tidyverse, ggplot2) for deeper analysis and reproducible workflows.
- Surveys: Google Forms, Typeform; pair with observational logs for mixed methods.
For Creative Production
- Visuals: Adobe Photoshop/Illustrator or free alternatives like GIMP and Inkscape.
- Interactive: p5.js for creative coding, or web frameworks for simple web-based interactives.
- Audio/Performance: Audacity, Ableton Live Lite, or mobile recording + simple DAW edits.
For Presentation
- Interactive exhibits: simple web pages with embedded visuals; USB-driven installations for in-person events.
- Poster sessions: one large visual poster + a 3–5 minute verbal pitch.

Assessment: How To Make Your Project Score Well
Most evaluators look for clarity, rigor, creativity, and impact. Use this compact rubric while planning so you don’t get surprised at the end.
| Criterion | What Strong Work Shows |
|---|---|
| Question & Focus | A tightly framed question with clear scope and relevance. |
| Methodological Rigor | Appropriate data or creative method, transparently documented and repeatable. |
| Interdisciplinary Integration | Balanced contribution from each discipline with meaningful synthesis. |
| Creativity & Communication | An engaging presentation or artifact that communicates findings clearly. |
| Ethics & Reflection | Evidence of ethical thinking, reflection on limitations, and next steps. |
Sample Capstone: From Prompt to Presentation
To make things concrete, here is a detailed example you can adapt.
Project Title
“Hot Spots and Cool Art: Visualizing Urban Heat Through Community-Sourced Data and Installation”
Research Goal
Map micro-heat islands in a neighborhood, partner with local artists to translate the data into an outdoor installation that educates residents and recommends simple cooling interventions.
Methods and Outputs
- Collect temperature and humidity using cheap sensors (e.g., DHT sensors) stationed at 20 locations for two weeks.
- Survey residents about outdoor usage and perceived heat discomfort.
- Produce a public installation—a row of freestanding panels whose colors correspond with measured heat—and an analytic report with mapped data and policy recommendations.
Assessment Plan
- Quantitative: statistical summary of temperature variance across sites.
- Qualitative: coded themes from resident interviews about heat and behavior.
- Impact: short visitor survey at the installation assessing awareness change.
Presentation Formats That Impress
Think beyond a slideshow. Choose formats aligned with your audience and deliverables:
- Poster + 5-minute pitch for AP Research or a school fair.
- Multimedia webpage with embedded visuals and audio interviews.
- Live demo or performance for interactive projects—short, rehearsed, and with fail-safes.
Common Pitfalls and How To Avoid Them
- Overambition: Scale your work to the time available; pick one deep question, not three shallow ones.
- Data without story: Numbers are only useful if they connect to human meaning; pair stats with narratives or design artifacts.
- Poor documentation: Keep a project journal. Future-you will thank present-you during write-up.
- Neglecting ethics: Consent and privacy are non-negotiable when people are involved.
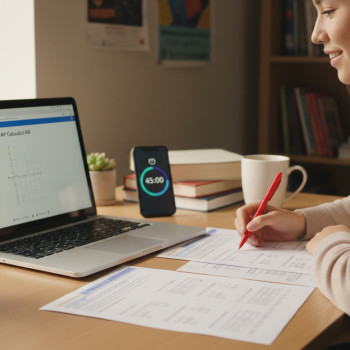
How to Use Tutoring Wisely: Where Personalized Help Fits
Capstones are messy: technical glitches, methodological uncertainty, and presentation nerves are normal. Personalized tutoring can help in precise ways—getting a second pair of eyes on your methods, building a tailored study plan for technical skills (like basic Python or statistics), or rehearsing your defense. If you’re using a tutoring service like Sparkl, focus sessions on:
- Designing a reproducible analysis pipeline (file structure, code style, versioning).
- Polishing the narrative arc of your report and presentation.
- Mock defenses and feedback from an expert who understands both the discipline and how to assess student work.
Personalized 1-on-1 guidance can be especially helpful for students mixing unfamiliar disciplines—an engineering-focused student learning interview techniques, or an arts student learning statistical basics. Sparkl’s tailored study plans and AI-driven insights can make those transitions smoother by recommending focused practice and resources based on your exact needs.
Final Tips from Teachers and Makers
Teachers and advisors often give the same handful of practical advice to successful capstone students—take these to heart:
- Start with a one-page plan and update it weekly.
- Pick partners or mentors deliberately; match skills and commitment.
- Fail fast—prototype early so you know what works and what doesn’t.
- Document continuously: photos, code comments, interview transcripts, and short reflective notes.
Wrapping Up: The Capstone as a Launchpad
Your capstone is more than a grade—it’s a portable slice of who you are as a thinker and maker. When you combine STEM with the Arts, or Social Science with Data, you prove you can move between modes of reasoning: from hypothesis to code, from numbers to narrative, from prototype to public-facing artifact. Use the frameworks above to shape a project that showcases both your analytical rigor and creative voice.
And remember: it’s okay to ask for help. Whether you need technical mentoring, feedback on your storytelling, or a customized plan to learn a new tool, targeted support—like the 1-on-1 guidance and tailored plans offered by tutoring services such as Sparkl—can sharpen your work without taking away your ownership. Your capstone should be yours; let thoughtful guidance be the wind behind it, not the hand on the pen.
Next Steps: Pick Your Project and Make a Simple Commitment
Choose one prompt above, write a one-paragraph project statement, and commit four small next steps for the next two weeks (e.g., literature scan, mentor outreach, prototype checklist, survey draft). That short, consistent momentum will put you miles ahead of students who wait for perfect conditions.
Final Encouragement
Interdisciplinary work is hard because it stretches you—technically, intellectually, and emotionally. But the payoff is enormous: graduates who can link data to human experience and craft solutions that are both effective and beautiful are the people who change things. Start small, iterate fast, and think of your capstone as both a culminating assignment and a creative experiment. You’ve got this.
Good luck—and if you ever want help turning your idea into a plan, consider a session focused on project structure, technical skill building, or presentation coaching. A little targeted help goes a long way.


No Comments
Leave a comment Cancel