
Why Flowcharts Work: Thinking Visually When It Counts
There’s a satisfying clarity to a flowchart: boxes, arrows, decisions, and a tidy path from start to finish. For students preparing for AP exams, that clarity isn’t just pretty — it’s powerful. Flowcharts translate messy, multi-step processes into visual sequences that are easier to remember, apply, and explain under timed conditions.
Whether you’re untangling metabolic pathways in Biology, balancing redox reactions in Chemistry, or tracking cause-and-effect across decades in History, a well-designed flowchart does three things for you: it reduces cognitive load, highlights decision points, and creates a rehearsal script you can run mentally during the exam.
How to Build Flowcharts That Actually Help
Not every flowchart is equally useful. The best ones are concise, consistent, and tailored to the question types you’ll face on an AP exam. Here’s a step-by-step method to create flowcharts that stick.
1. Define the scope
Start by asking: what exactly am I modeling? A whole chapter of cellular respiration is too broad; pick a single process like glycolysis, electron transport, or ATP synthesis. For History, narrow a broad theme—e.g., the causes and consequences of the Haitian Revolution rather than “revolutions in the Atlantic World.”
2. Identify inputs, steps, and outputs
Break the process into: inputs (what starts it), steps (what happens), and outputs (the end result or product). In Chemistry, an input might be reactants and conditions; steps are mechanistic events; output is product and energy flow. For history, inputs are causes or catalysts; steps are key events/policies; outputs are consequences or long-term changes.
3. Use consistent shapes and labels
Decide what each shape means: rectangles for steps, diamonds for decisions, ovals for start/end. Keep labels short and action-oriented (e.g., “Phosphorylate Glucose,” not “The enzyme hexokinase phosphorylates glucose in the cytoplasm”). Consistent visuals let your brain recognize patterns faster during review and under pressure.
4. Highlight decisions and branching
Many processes split based on conditions: oxidative vs. fermentative respiration, acidic vs. basic reaction pathways, or political vs. economic drivers in history. Use diamonds and clear yes/no or condition labels to show branches. These decision nodes are often where exam questions live.
5. Keep a legend and a reductionist summary
On complex charts add a small legend (symbols, color codes). Below the chart, keep a one- or two-sentence summary that captures the essence — your “elevator pitch” for the process.
Flowcharts in AP Chemistry
Chemistry problems often require multi-step reasoning: choose a reagent, predict intermediates, state energy changes, or determine rates. Flowcharts are ideal for scaffolding these steps into a reproducible method.
Common chemistry flowchart types
- Reaction classification: Is it acid-base, redox, substitution, or elimination?
- Mechanism selection: Does the substrate favor SN1 or SN2? (Show branching by substrate, nucleophile strength, solvent).
- Titration decision tree: How to find equivalence point from pH curve and select indicator.
- Thermodynamics vs kinetics: Pathways depending on temperature, catalysts, and activation energy.
Example: Acid–Base Reaction Flowchart
Here’s a compact table to help organize a typical acid-base question — a bridge between a conceptual flowchart and a quick-reference study tool.
| Step | Question to Ask | Action |
|---|---|---|
| Identify species | Which substances present? Weak or strong acid/base? | Label strong acids/bases; write conjugate partners. |
| Predict direction | Which side has weaker acid/base? | Arrow toward weaker acid/base (use pKa if available). |
| Check stoichiometry | Will any limiting reagent control pH? | Calculate equivalents; adjust final concentrations. |
| Find pH | Is buffer present? Is solution dilute? | Use Henderson–Hasselbalch if buffered; ICE table if not. |
Turn that table into a flowchart by arranging boxes in the same order and adding decision diamonds at “Identify species” and “Predict direction.” That gives you a reproducible strategy under time pressure.
Flowcharts in AP Biology
Biology is rich with processes: cellular respiration, gene expression, immune responses, and ecological cycles. Flowcharts help with sequencing and with linking cause and effect — exactly what free-response questions often require.
Key patterns to map in Bio
- Linear pathways: steps in glycolysis, Calvin cycle, or transcription/translation.
- Branching pathways: metabolic choices (fermentation vs aerobic respiration).
- Feedback and regulation: negative vs positive feedback loops.
- Experimental design: hypothesis → control/variable → expected results → interpretation.
Example: Cellular Respiration Branching Chart
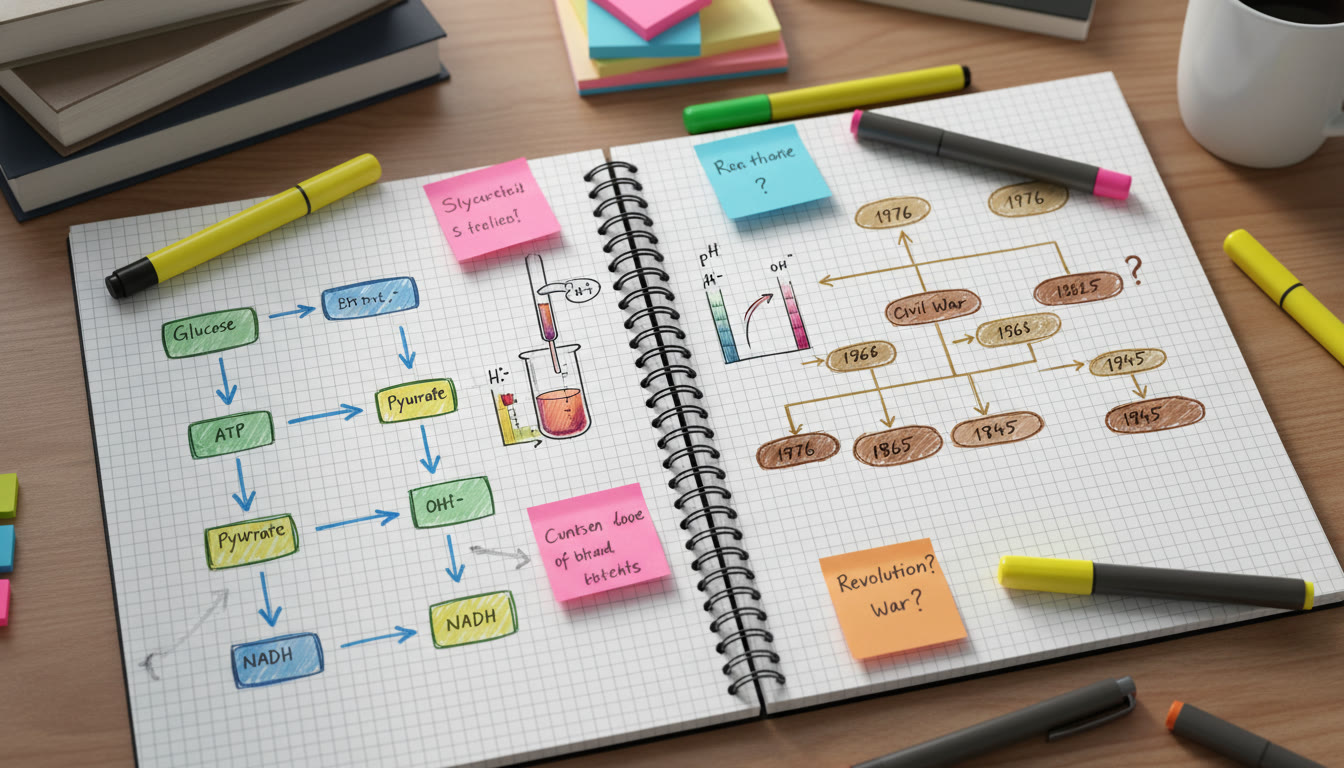
Imagine a chart that begins with “Glucose enters cell” and branches at “Is oxygen present?” Yes leads into pyruvate → acetyl-CoA → Krebs → ETC; No leads into pyruvate → fermentation (lactate or ethanol). On each branch annotate ATP yield, NADH usage, and location (cytoplasm vs mitochondrion). This compact visualization helps answer “Compare and contrast” prompts quickly and accurately.
Flowcharts in AP History
History might seem less procedural, but it’s full of cause-and-effect chains, contingency paths, and feedback loops — all perfect for flowcharting. Good historical flowcharts don’t reduce nuance; they make complex relationships teachable and testable.
When to use flowcharts in History
- Tracing the causes and consequences of an event (e.g., causes of WWI and subsequent geopolitical shifts).
- Policy decision trees (how a domestic policy choice leads to economic and social outcomes).
- Comparative timelines showing parallel events and diverging outcomes across regions.
Example: Revolution Cause-and-Effect Chart
Start with long-term structural causes (economic inequality, class tensions), add short-term triggers (bread riots, fiscal crisis), then branch to immediate outcomes (regime collapse, conservative reaction) and long-term consequences (constitutional change, lasting social reform). Use arrows to show feedback (e.g., repression leading to radicalization) and color-code actors (elite, popular, external powers).
Study-Session Recipe: Building a Flowchart in 30–45 Minutes
Here’s a practical routine you can use during a focused study session. Treat this like a mini-lab for your brain.
- 5 minutes — Choose the process and gather sources (class notes, textbook, past FRQs).
- 10 minutes — Draft a rough sketch: identify start/end points and 5–10 major steps.
- 10 minutes — Add decision nodes, annotate with short labels (enzyme names, pKa, key dates), and color-code branches.
- 5–10 minutes — Condense into a one-line summary below the chart and create a flashcard with the summary and one key decision point.
- Optional 5 minutes — Compare with a sample student response or rubric to ensure you captured the elements that earn points.
Using Flowcharts During AP Practice and Exams
Flowcharts aren’t just for studying — they’re rehearsal tools. Use them as a mental checklist while you answer multiple-choice and free-response questions:
- Before you start writing an FRQ, run the chart in your head to organize paragraphs logically.
- For multiple-choice items that trap you in a partial path, trace branches to see which condition flips the outcome.
- Use a tiny margin flowchart (or shorthand symbols) to map quick steps when time is tight — a “microflowchart” fits in the left margin of your scratch paper.
Examples That Tie It All Together
Below are three short, practical flowchart templates you can adapt for AP practice. These are condensed — the idea is to build them out in your notes with specific labels from your course materials.
Chemistry: SN1 vs SN2 Decision Tree
- Start: Identify substrate (primary/secondary/tertiary)
- Decision: Nucleophile strength? Strong → favors SN2; Weak → consider substrate and solvent
- Decision: Solvent polar protic? Polar protic + tertiary → SN1 likely
- Outcome: Predict stereochemistry and rate law (bimolecular vs unimolecular)
Biology: Gene Expression Quick Flow
- Start: Signal (hormone, transcription factor)
- Decision: Does the signal affect transcription or translation?
- Transcription path: Promoter binding → mRNA synthesis → splicing → export → translation
- Annotate regulation points: enhancers, silencers, post-translational modification
History: Policy to Consequence Path
- Start: Policy enacted (tax reform, trade tariff)
- Immediate effects: stakeholder reaction, economic indicators
- Mid-term: political opposition, protests, legislative reversal
- Long-term: institutional change, precedent, regional influence
Common Mistakes and How to Fix Them
Students often make similar errors when creating flowcharts. These are easy to spot and correct:
- Too many words — Keep labels concise. If a label needs a sentence, it probably belongs in an annotation or a separate note.
- Ignoring exceptions — Add small conditional notes for common caveats (e.g., “unless catalyst present” or “if oligarchs intervene”).
- Overcomplication — If a chart has more than three branches at one node, consider splitting it into two charts to preserve clarity.
- No rehearsal — A flowchart is only useful if you use it repeatedly. Mix it into flashcards, quick quizzes, and timed FRQs.
Digital vs Hand-Drawn Flowcharts
Both styles have benefits. Hand-drawn charts are faster and promote memory through motor encoding; digital charts are cleaner, shareable, and easy to update. Many students adopt a hybrid approach:
- Sketch by hand the first two times you learn a process to force active encoding.
- Then create a clean digital version (simple shapes, consistent colors) to print or save in a study deck.
Tools are useful, but don’t get stuck perfecting visuals — the learning happens when you refine and use the chart.
How Personalized Tutoring Enhances Flowchart Mastery
Flowcharts are inherently personal: the way you mentally chunk a process will reflect how you think. That’s why 1-on-1 guidance matters. A tutor can:
- Help you find the essential decision nodes that are likely to appear on AP prompts.
- Create tailored study plans that integrate flowchart practice with FRQs, multiple-choice drills, and periodic review.
- Offer targeted, expert feedback on your chart’s logic and completeness, and help translate it into exam-ready language.
Services like Sparkl’s personalized tutoring combine expert tutors with AI-driven insights to highlight weak spots, suggest practice problems, and keep your flowcharts aligned with scoring rubrics. That kind of feedback loop can shave weeks off unfocused study.
Turning Flowcharts into Active Recall Tools
A flowchart’s real power comes when you use it for active recall. Try these techniques:
- Cover the chart and reconstruct it from memory; compare and correct.
- Use the chart as the backbone of mock FRQs: convert each node into a question you must answer in writing.
- Partner up: explain your chart aloud to a study partner in three minutes or less. Teaching forces clarity.
Sample Mini-Flowchart Drill (5 Minutes)
Practice drill you can do between classes:
- Pick a process (e.g., tetanus infection steps, nitration mechanism, or the New Deal reforms).
- Set a timer for 2 minutes and sketch a flowchart with 6–8 nodes.
- Stop and write a one-sentence summary under it.
- Spend 2 more minutes expanding one key node with annotations (enzymes, dates, or experimental predictions).
Final Tips: Make Flowcharts a Habit
Consistency beats intensity. A few tidy flowcharts for the most tested processes in each AP course will give you outsized returns. Keep these closing tips in mind:
- Prioritize processes that are commonly tested and those you find confusing.
- Keep a dedicated flowchart notebook or digital folder. Review it weekly.
- Use color sparingly — one or two colors to mark decision points and outcomes is enough.
- Translate flowcharts into quick-margin scribbles for exam use; they should be compact and legible.

Wrapping Up: Visual Thinking as a Competitive Edge
Flowcharts turn complexity into a playable script. For AP students, that’s the difference between staring at a blank FRQ and confidently outlining an answer that hits all the rubric points. Use them to map decisions, rehearse explanations, and rehearse under timed conditions. Pair your practice with targeted feedback — whether from a teacher, an effective tutor, or personalized programs like Sparkl that weave expert coaching and AI-driven study plans — and you’ll find your mental pathways are as well-organized as your charts.
Start small, iterate often, and treat each flowchart as a living study tool. After a few rounds of creation and active recall, you’ll notice processes that once felt opaque become second nature — and during the exam, that automaticity is pure advantage.
Good luck — and happy charting.


No Comments
Leave a comment Cancel