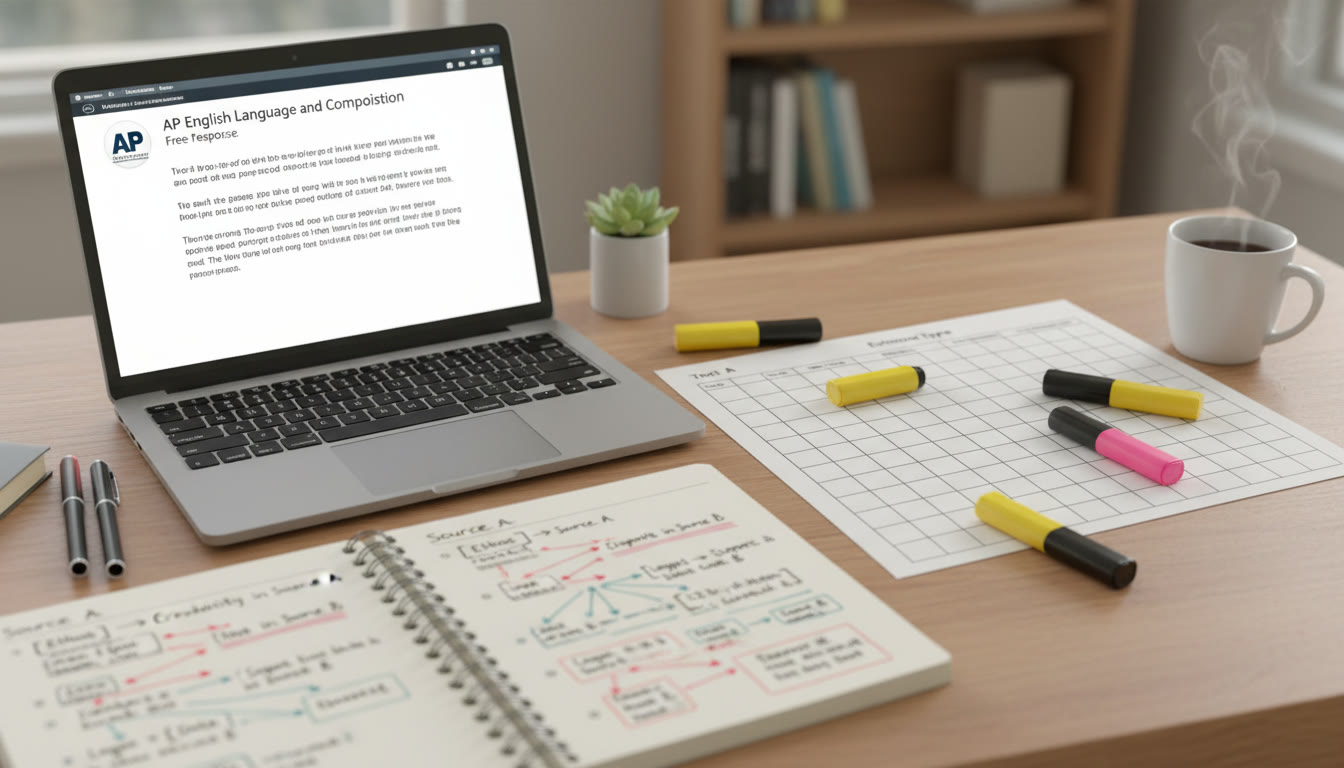
Why Cross-Referencing Figures Matters for AP Exams
Walk into any AP exam room — from Biology to U.S. History to English Language — and you’ll find one consistent truth: the best answers are the ones that connect evidence to argument. Cross-referencing figures and integrating multiple media (charts, images, tables, audio transcripts, maps, and even short video descriptions) turns a good response into a great one. For AP students, this skill isn’t optional; it’s evidence literacy, and it directly affects how your claims are judged.
In practice, cross-referencing means two things: (1) reading each media item carefully (not just the prompt) and (2) weaving those items into your reasoning so every claim ties back to specific evidence. When you do that, graders see clarity, depth, and command of source material — three things AP rubrics tend to reward.

How Different AP Subjects Use Multiple Media
Each AP subject asks you to use evidence, but they ask it in slightly different languages. Recognizing those differences is the first step to smart cross-referencing.
AP Biology and AP Chemistry
These exams present graphs, tables, and lab descriptions. The trick: synthesize quantitative and qualitative info. A table might show enzyme activity while a figure shows temperature trends. Don’t treat them separately — explain how the table’s values support trends the figure suggests.
AP United States History and AP European History
Maps, political cartoons, and excerpts from speeches are common. Cross-referencing involves linking primary-source tone to visual cues. If a cartoon exaggerates a politician’s features, pair that reading with a letter or law from the same period to show contrast between public image and policy.
AP English Language and Composition
Here, integrating images or short excerpts is rare, but when present, the task is rhetorical synthesis: relate visual choices to diction, syntax, and rhetorical strategies in the text. Describe, then analyze — and always connect back to the author’s purpose.
AP Computer Science Principles and AP Art and Design
Digital artifacts, code snippets, and multimedia projects are fair game. For AP CSP, cite data visualizations beside your explanation of algorithmic choices; for Art and Design, talk about the process (sketches, edits) and how digital manipulations changed meaning or clarity while respecting portfolio rules on attribution.
Practical Steps to Cross-Reference Figures Like a Pro
Below is a step-by-step workflow you can practice in timed drills so the technique becomes second nature on exam day.
- Scan first, then read deeply: Spend the first 30–60 seconds scanning all figures to build a mental map. Identify labels, axes, captions, dates, and unusual marks.
- Annotate selectively: Circle key numbers, underline phrases in captions, and label figures with quick shorthand (e.g., “F1 trend up 1990–2000”). Use this annotated shorthand in your response.
- Pair evidence to claim: For every assertion, cite the specific figure and element (e.g., Table 2, row 3) that supports it. In AP free responses, concise parenthetical references like (Fig. 1) are acceptable and helpful.
- Explain the link: Don’t just name the figure. Say how or why the data supports the point — describe the mechanism, pattern, or implication.
- Resolve contradictions: If two figures seem to disagree, use that tension. Explain possible reasons (method differences, sample size, perspective) and use critical thinking to evaluate which evidence is stronger.
- Keep timing in mind: Reserve a few minutes near the end of your essay to validate that your cross-referencing is consistent and visible to the grader.
Example Walkthroughs: Applying Cross-Referencing in Three AP Scenarios
Concrete examples stick. Below are summary walkthroughs you can replicate in practice sets.
AP Biology Free Response Example
Prompt includes: a line graph of population density across temperature ranges (Fig. 1), a bar chart of enzyme activity vs. pH (Fig. 2), and a short experiment description noting sample size.
- Start by stating your claim: “Temperature X limits population growth due to enzyme denaturation that reduces metabolic rate.”
- Refer: “Fig. 1 shows population decline above 30°C; Fig. 2 shows enzyme activity dropping sharply past pH 8.”
- Explain: connect how enzyme sensitivity affects metabolic processes and thus population size. Mention sample-size caveat from the experiment description to show nuance.
- Finish: propose a short follow-up experiment — changing pH across temperatures to test interaction effects.
AP United States History Short-Answer Example
Prompt includes: a political cartoon (Fig. A), an excerpt from a 1900s speech (Doc B), and a demographic table (Table C).
- Claim: “The cartoon reflects public anxiety about immigration that contrasts with political rhetoric assuring economic benefits.”
- Refer: “Fig. A uses caricature and labels to depict immigrants as ‘threatening jobs’; Doc B uses language promising industrial growth through labor.”
- Explain: analyze the cartoon’s rhetorical devices and link them to the table’s data showing wage stagnation in certain sectors (Table C), which could fuel the cartoon’s sentiment.
- Contextualize: briefly place the sources within the era’s politics and conclude with assessment of which source better represents mainstream opinion and why.
AP English Language Rhetorical Analysis Example
Prompt provides a short prose passage and a photograph used in a related ad campaign.
- Claim: “The photograph’s visual framing intensifies the speaker’s claim of isolation.”
- Refer: “The close-up and shallow depth of field (Photo) complement the passage’s anaphora and short declarative sentences.”
- Explain: show how the visual choices mirror rhetorical devices and strengthen the argument’s emotional appeal.
One Table to Practice With: Evidence Mapping Template
Use this simple table in practice to map claims to pieces of evidence and to plan your explanation and caveat. Copy it into your notebook during timed practice.
| Claim | Primary Figure (Label) | Key Detail From Figure | How It Supports Claim | Counterpoint/Caveat |
|---|---|---|---|---|
| Population declines after 30°C | Fig. 1 | Sharp drop in density between 30–35°C | Suggests thermal tolerance limit affecting reproduction | Sample size small; seasonal confounders |
| Public fear of job loss | Fig. A (cartoon) | Caricature of immigrant taking job | Visual symbol aligns with anti-immigrant rhetoric | Political speeches emphasize labor demand |
Common Pitfalls and How to Avoid Them
Even experienced students slip up. Here are the most frequent mistakes and quick fixes.
- Pitfall: Quoting a figure without explaining its meaning.
Fix: Always add one sentence that interprets the figure and connects it to your claim. - Pitfall: Overwhelming the reader with numbers.
Fix: Use the most meaningful statistic and translate it into plain language (e.g., “a threefold increase” rather than a long list of numbers). - Pitfall: Ignoring figure labels or units.
Fix: Mention units when relevant — graders notice precision. - Pitfall: Treating all sources as equally credible.
Fix: Briefly assess source limitations: sample size, perspective, or date.
Practice Drills to Build Cross-Referencing Fluency
Schedule short, frequent drills that mirror exam conditions. Here’s a weekly plan you can adopt and adapt.
- Three-times-a-week: 20-minute figure-synthesis drills. Use one chart + one short text; write a 200–300 word synthesis that cites both.
- Once a week: Full timed free-response under exam conditions (40–60 minutes). Practice marking figures and leaving a minute at the end to proof your evidence links.
- Monthly: Swap drills with a peer. Grade each other’s evidence use and note where cross-references are missing or unclear.
How Sparkl’s Personalized Tutoring Can Help (When It Fits Naturally)
Many students find that one-on-one guidance accelerates skill building. A tutor who models the cross-referencing process, gives targeted feedback on how you cite figures, and co-creates a tailored practice plan helps make the technique automatic. Tools like AI-driven insights can highlight patterns you miss and suggest specific practice drills; when combined with human feedback, this hybrid approach makes it easier to move from understanding to mastery.
Marking Up Figures: Sample Annotation Conventions
Develop a consistent shorthand so your brain spends less energy deciding what to write and more on analysis. Below are sample marks to try during practice. Use pencil and a light hand so your writing stays legible.
- F1, F2 — label figures in the margin in order
- → or ← — indicate causality or direction described in the figure
- * — flag the most convincing piece of evidence
- Q? — mark data that raises a question or contradiction
- (n=) — note sample sizes or units if shown
Using Cross-Referencing to Improve Your AP Scores: What Graders Look For
Understanding the rubric helps you write what graders are trained to reward. Across AP formats, graders look for:
- Clear, specific claims tied to evidence
- Accurate interpretation of figures
- Consideration of limitations and alternative explanations
- Coherent organization and explicit links between sources
When you cross-reference well, you hit each of these targets. Your answer reads like an argument supported by documentary proof — exactly the impression graders want.
Real-World Context: Why This Skill Matters Beyond the Exam
Cross-referencing multiple media is not just an exam trick; it’s how professionals make decisions. Scientists compare charts and lab notes, historians cross-check maps and letters, journalists synthesize interviews and data visualizations, and designers pair user testing metrics with interface mocks. Practicing this in AP class prepares you for college work and real-world problem solving.
Final Checklist for Exam Day: Cross-Referencing Cheat Sheet
Keep these quick commands in the back of your head as you write your next practice free-response or sit the exam.
- Scan all figures first — 30–60 seconds.
- Label figures in the margin (Fig. 1, Fig. 2).
- Make one specific reference per major claim (e.g., “(See Fig. 2)”).
- Explain how the figure supports the claim — don’t assume the grader will infer it.
- Add one limitation or alternative explanation to show critical thinking.
- If time allows, reread and underline each instance where you cite a figure so graders see your evidence trail.

Wrap-Up: Make Cross-Referencing an Unmissable Habit
Treat cross-referencing figures and media not as a bonus, but as part of your writing and reasoning architecture. It starts with disciplined practice: annotate, pair, explain, and reflect. Use the drills and templates above two to three months leading up to your AP test date, and you’ll notice your answers tightening, your evidence becoming more persuasive, and your confidence growing.
Finally, remember that targeted support can compress months of trial-and-error into weeks of meaningful improvement. If you choose to work with a tutor, look for one who emphasizes evidence-mapping, gives rapid, specific feedback on how you tie claims to media, and helps tailor practice to your weakest areas. That kind of personalized tutoring makes cross-referencing less intimidating and much more likely to stick.
Practice with purpose, annotate with intention, and let your evidence do the heavy lifting. The AP grader wants to see that you don’t just know the facts — you can use them.


No Comments
Leave a comment Cancel