Why r, K, and Growth Models Matter (and Why You’ll Care)
If you’re preparing for AP Biology or just trying to get a real feel for how populations change over time, the math behind ecology isn’t just for show. Understanding r, K, logistic growth, and exponential growth gives you a powerful lens to explain why certain species boom and why others stabilize. These concepts show up on exams, in labs, and in real-world problems like conservation planning, pest control, and predicting how diseases spread.
Big picture quick answer
Exponential growth (driven by r) describes rapid, unchecked increase. Logistic growth adds realism: as resources run out, growth slows and levels off at a carrying capacity (K). r and K are shorthand for different life-history strategies and mathematical parameters that describe how populations respond to their environment.
Key Terms — A Tiny Glossary That Matters
- r (Intrinsic Rate of Increase) — The per capita growth rate when conditions are ideal. High r means fast growth.
- K (Carrying Capacity) — The maximum population size the environment can sustain long-term.
- Exponential Growth — Growth without limits; described by a simple exponential equation.
- Logistic Growth — Growth that slows as the population approaches K; produces the classic S-shaped curve.
- Density-Dependent Factors — Things like competition, disease, and predation that become stronger as population increases (they shape logistic growth).
- Density-Independent Factors — Weather, disasters, or chemical spills; they affect populations regardless of size.
Exponential Growth: The Unfettered Sprint
The Equation and the Intuition
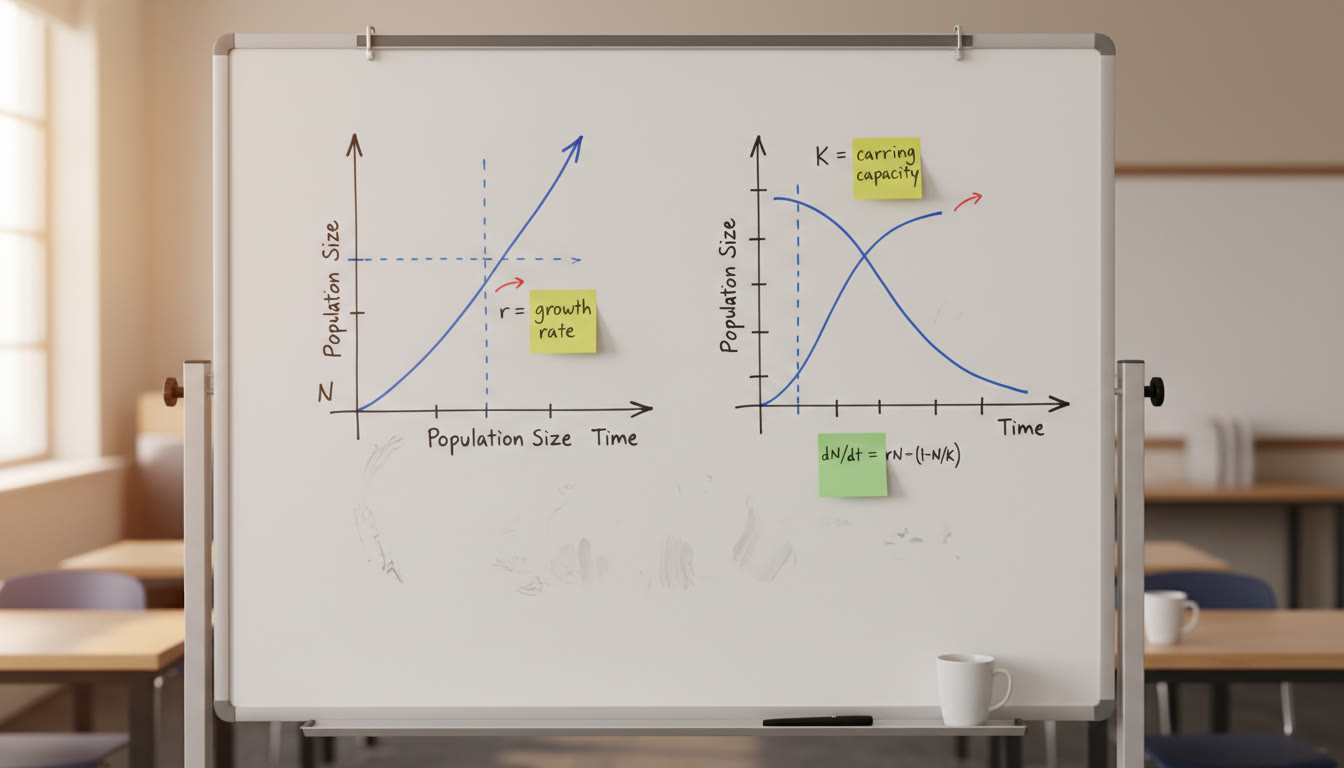
The exponential growth model assumes unlimited resources. Its continuous form is usually written as:
dN/dt = rN
Read this as “the change in population size over time equals r times current population size.” When r is positive, the population grows ever faster because more individuals produce more offspring — a multiplying effect.
A Real-World Example (Simplified)
Imagine a bacterial culture in a petri dish with abundant nutrients. Each bacterium divides, doubling the population at consistent intervals — early on, the curve shoots upward because nothing is limiting reproduction. In nature, exponential growth is often temporary: it describes early colonization or outbreaks before resources or predators intervene.
Logistic Growth: The Marathon With Traffic Lights
The Equation and the Intuition
Logistic growth adds a braking mechanism that slows growth as the environment becomes crowded. The continuous logistic equation is:
dN/dt = rN (1 – N/K)
Here, the term (1 – N/K) reduces growth as N (population size) approaches K. When N is much smaller than K, (1 – N/K) ≈ 1 and growth behaves almost exponentially. As N gets close to K, the term shrinks and dN/dt approaches zero, causing the S-shaped (sigmoidal) curve.
Why Logistic Is More Realistic for Most Populations
Most ecosystems have limits: food, habitat, mates, nesting sites. Logistic growth captures competition for those resources and how they slow population growth. It’s helpful for modeling forests, animal populations, and even many human-influenced systems where resources are finite.
r- and K-Selection: Life Strategies in a Sentence
Two Ends of a Spectrum
Evolutionary ecologists use r and K to describe life-history strategies. Think of them as two ends of a survival strategy spectrum:
- r-selected species: Produce many offspring, mature quickly, often small-bodied (e.g., many insects, annual plants). They excel in unpredictable or newly available habitats where rapid reproduction is an advantage.
- K-selected species: Produce fewer offspring, invest heavily in each, often larger and longer-lived (e.g., elephants, humans in many contexts). They compete well when populations live near carrying capacity and resources are limited.
Real species don’t always fall purely into one category — many lie somewhere in the middle. The r/K framework is a useful shorthand to think about trade-offs between quantity and investment.
Comparing Logistic and Exponential Growth — At a Glance
| Feature | Exponential Growth | Logistic Growth |
|---|---|---|
| Equation (continuous) | dN/dt = rN | dN/dt = rN (1 – N/K) |
| Shape of Curve | J-shaped | S-shaped (sigmoidal) |
| Limiting Factors | None (assumes unlimited resources) | Density-dependent factors limit growth as N → K |
| When It Applies | Early colonization, invasive species, epidemic phase | Stable ecosystems, long-term population dynamics |
| Typical r/K Strategy | r-selected species | K-selected species |
Worked Examples — Because Numbers Make It Click
Example 1: Exponential Growth of a Small Population
Suppose a population has r = 0.5 per year and initial size N0 = 10. Using the exponential formula N(t) = N0 e^{rt}, after 2 years:
N(2) = 10 × e^{0.5 × 2} = 10 × e^1 ≈ 10 × 2.718 ≈ 27.18
That’s almost a tripling in two years — exponential growth compounds rapidly.
Example 2: Logistic Growth Approaching Carrying Capacity
Now suppose r = 0.5, K = 50, and N0 = 10. At low N, growth approximates exponential. But as N grows, the factor (1 – N/K) slows the growth. After some time, the population will approach 50 and hover near that value, with small fluctuations due to births and deaths.
Without showing long differential equation solutions here, the intuitive lesson is: identical r values can yield very different long-term outcomes depending on K and density effects.
Common Pitfalls Students Make (and How to Avoid Them)
- Confusing r and K: r is a rate (how fast), K is a carrying capacity (how many). Keep that distinction clear when you see equations or word problems.
- Assuming exponential forever: Real ecosystems rarely sustain indefinite exponential growth — mention limiting factors in explanations.
- Ignoring units: If r is per year, time t must be in years. Always check units before plugging numbers into formulas.
- Overapplying r/K labels: The r/K framework is heuristic. Many organisms show mixed strategies or switch strategies depending on environment.
How You’ll See These Topics on AP-Style Questions
AP Biology questions often combine conceptual understanding with data interpretation. You might be given a graph and asked to identify phases of growth, calculate r from early exponential data, or predict the effect of changing K (for example, adding food or creating habitat). Labs might ask you to analyze population data and decide whether logistic or exponential models fit best.
Example AP-Style Prompt
“A population of small mammals is introduced to an island. The following data show population size over time. Determine whether growth is exponential or logistic, estimate r during the first phase, and predict what will happen if a predator is introduced that increases mortality in a density-dependent way.”
Notice the skills the question tests: graph interpretation, model selection, rate estimation, and understanding of density-dependent impacts.
Practice Strategies That Actually Work
- Sketch the curves. Drawing exponential and logistic graphs helps your brain lock in the differences more than memorizing formulas alone.
- Work backwards. Given a graph, ask “What would r and K have to be to make this happen?” It helps you translate visual data into math.
- Check units and scales. Small differences in axes (linear vs. logarithmic) can change how growth looks — learn to spot axis labels quickly on exams.
- Practice AP-style data questions. Time yourself and explain your reasoning out loud or in writing, as free-response questions ask for explanation and justification.
- Get targeted help when stuck. Short, focused tutoring sessions can make a big difference when you’re struggling with translating biology into equations.
When to Use Which Model: A Practical Decision Guide
- Use exponential growth when resources are effectively unlimited for the time period in question — e.g., early colonization of a new habitat, initial outbreak phase of a pathogen.
- Use logistic growth when resource limitation, competition, or density-dependent effects are expected to influence the population within the timeframe.
- When in doubt, describe both models briefly and explain why one fits observed data better; AP graders reward clear justification.
Visual Intuition: Why the S-Shape Appears
Think of a population as a growing company. Early on, the company expands rapidly because the market is wide open and competition is low (exponential phase). As competitors enter and resources (customers, employees, office space) become scarce, growth slows and eventually reaches a plateau — that plateau is the carrying capacity. The logistic model compounds per-capita growth with the fraction of resources left (1 – N/K), so the growth rate decreases smoothly rather than abruptly.
Extensions and Real-World Twists
Oscillations and Overshoot
Some populations temporarily overshoot K and then crash, producing damped oscillations. Time lags in reproduction, resource regeneration rates, or predator-prey dynamics can cause these effects. Classic examples include certain rodent populations that explode after a favorable season and then crash when resources are exhausted.
Density-Dependent Versus Density-Independent Mortality
Incorporating these factors changes predictions. Density-dependent mortality increases with N and pushes dynamics toward logistic behavior. Density-independent events (wildfire, extreme storm) can cause sudden drops regardless of whether a population is near K or far below it.
Stochasticity and Real Populations
Real populations face random events — small chance disasters or unusually productive seasons. Stochastic models build unpredictability into population projections. For AP-level work, you should be able to explain how such randomness could make outcomes deviate from simple deterministic models.
Study Plan — 2 Weeks to Better Understanding
- Days 1–3: Review definitions, sketch graphs, and practice simple exponential and logistic equations by hand.
- Days 4–7: Work AP-style data interpretation problems — focus on translating graphs into words and equations.
- Days 8–10: Tackle mixed problems that involve r/K life-history reasoning and the effect of density-dependent factors.
- Days 11–14: Timed practice with free-response style questions; get feedback on explanations and clarity.
If you want to accelerate this plan, targeted 1-on-1 tutoring can cut confusion time dramatically: a tutor can spot misunderstandings, give clear examples, and tailor practice problems to your weak spots. Sparkl’s personalized tutoring offers tailored study plans and expert tutors that can help you prioritize topics and build confidence quickly.
Checklist: What You Should Be Able to Do
- Define r and K and explain how they influence population change.
- Differentiate between exponential and logistic growth both mathematically and graphically.
- Estimate r from early growth data and explain how K modifies long-term dynamics.
- Interpret AP-style prompts and explain your reasoning in clear, concise sentences.
- Discuss real-world factors (density-dependent and independent) that push a population toward a logistic model or disrupt it.
Quick Reference: Equations and Interpretations
| Model | Continuous Equation | Interpretation |
|---|---|---|
| Exponential | dN/dt = rN | Growth rate proportional to current size; unlimited resources assumed. |
| Logistic | dN/dt = rN (1 – N/K) | Growth slows as N approaches K; includes density-dependent regulation. |
Parting Advice — How to Sound Like You Know What You’re Talking About
When writing or speaking about r, K, or growth curves on an AP exam, clarity matters as much as correctness. Start by naming the model, cite the key evidence (shape of curve, numerical trend, presence of limiting factors), and finish with a one-sentence implication (for example, “This suggests the population will stabilize near K unless external disturbances occur.”). That structure — model, evidence, implication — gets you points and demonstrates scientific thinking.
Don’t forget: targeted help, like brief one-on-one sessions, can turn trial-and-error into efficient learning. If you’re juggling multiple topics, Sparkl’s approach — combining expert tutors with personalized study plans and AI-driven insights — can make practice time much more productive and keep you exam-ready without burning out.
Final Quick Practice Problem (Try It Now)
Given: A population starts at 20 individuals. It grows to 40 in one year under near-ideal conditions. Estimate r and decide whether a logistic or exponential model is better if the habitat supports a maximum of ~100 individuals. Explain briefly.
Suggested approach: Use N(t) = N0 e^{rt} with t = 1 to estimate r, then consider K = 100 to discuss whether exponential assumptions hold long-term. (Answer: r ≈ ln(40/20) = ln 2 ≈ 0.693 per year; exponential fits early growth, but with K = 100, logistic gives a more realistic long-term outlook.)
Wrap-Up
r, K, exponential, and logistic growth are more than classroom vocabulary — they’re a compact language for describing how life expands and balances. Make sure you can move between equations, graphs, and words; practice interpreting real data; and when you need focused feedback, short targeted tutoring sessions can accelerate mastery. With steady practice and clear explanations, these concepts become intuitive tools you’ll reach for again and again in ecology, conservation, and on the AP exam.


No Comments
Leave a comment Cancel