Why Spectra Matter (and Why You’ll Love Them)
Imagine being handed an unknown molecule and, like a detective, piecing together its identity from clues. That’s what spectroscopic techniques let you do. Infrared (IR), Mass Spectrometry (MS), and Ultraviolet–Visible (UV-Vis) spectroscopy are three of the most powerful clues in an AP Chemistry or organic chemistry toolkit. Together they tell you what bonds are present, what the molecular weight is, and what electronic features (like conjugation) exist. This guide walks you through the essentials in a conversational, example-driven way so you can confidently approach spectrum-based questions on the AP exam and in lab reports.

Quick Map: What Each Technique Tells You
Before diving into details, here’s a one-line summary so you can keep the roles straight while you study.
- IR Spectroscopy: Fingerprints of functional groups — which bonds are present.
- Mass Spectrometry: Molecular weight and fragmentation patterns — how big the molecule is and how it breaks apart.
- UV-Vis Spectroscopy: Electronic transitions — conjugation and chromophores (colors and absorbance).
Infrared (IR) Spectroscopy — The Functional Group Detective
How IR Works (Simple Explanation)
IR measures how molecules absorb infrared light, which causes bonds to vibrate. Different bonds vibrate at characteristic frequencies, so an IR spectrum (a plot of absorbance vs. wavenumber in cm−1) becomes a map: peaks correspond to bond vibrations. On the AP exam, knowing the major peaks and what they imply gets you most of the way.
Key Peaks to Recognize
- O–H (alcohols, phenols): 3200–3600 cm−1 — broad, often rounded.
- N–H (amines): 3300–3500 cm−1 — sharper, may show one (secondary) or two (primary) peaks.
- C–H (alkanes): ~2850–2960 cm−1 — several peaks from C–H stretching.
- C≡C and C≡N: ≈2100–2260 cm−1 — sharp, narrow peaks.
- C=O (carbonyls): 1650–1750 cm−1 — strong, sharp peak (key for ketones, aldehydes, carboxylic acids, esters).
- C=C (alkenes, aromatics): 1500–1600 cm−1 and weaker bands around 1600 cm−1.
Tips and Example
Tip: If you see a very strong, sharp peak near 1700 cm−1, think carbonyl first. But context matters — the presence of a broad O–H stretch and a 1700 cm−1 peak suggests a carboxylic acid (which also often shows a very broad O–H from 2500–3500 cm−1), whereas a sharp 1700 cm−1 with C–O stretches in the 1050–1300 cm−1 region could be an ester.
Example: A spectrum shows a broad band at 3300 cm−1 and a strong, sharp band at 1715 cm−1. Likely functional groups: alcohol (or carboxylic O–H) and a carbonyl — consider a carboxylic acid or a molecule with both alcohol and carbonyl functionality.
Mass Spectrometry (MS) — The Molecular Weight and Fragmentation Map
How MS Works (Concise)
In MS, molecules are ionized (often by electron impact or electrospray), and fragments are detected as mass-to-charge (m/z) ratios. The tallest peak in many organic mass spectra is the base peak (most intense), and the molecular ion peak (M+) indicates the molecular mass (if present). Fragmentation patterns help deduce substructures.
Important Features to Spot
- Molecular Ion (M+): Gives molecular weight — the most valuable single clue.
- Base Peak: Highest intensity — often a stable fragment that reveals a favored cleavage.
- Isotopic Patterns: Chlorine (35/37) and bromine (79/81) show distinctive peak ratios: Cl → ~3:1, Br → ~1:1. These patterns are immediate giveaways.
- Common Fragment Masses: For example, loss of 18 m/z often indicates H2O loss (dehydration). Loss of 15 m/z might be a methyl (CH3) loss.
Interpreting Fragments — An Example Approach
Start by locating M+. If you find M+ at m/z 122 and see a strong fragment at m/z 107 (loss of 15), suspect a methyl cleavage. If you observe a pair of peaks 2 m/z apart with ~3:1 ratio, think chlorine. The way fragments appear and their relative intensities reflect where the molecule prefers to break — and common stable fragments (like tropylium ion at m/z 91 from benzyl fragments) are useful to memorize.
UV-Visible (UV-Vis) Spectroscopy — Seeing Conjugation and Chromophores
How UV-Vis Works (Short)
UV-Vis measures light absorption that promotes electrons from lower-energy to higher-energy molecular orbitals (most often pi to pi* or n to pi* transitions). The key output is λmax (wavelength of maximum absorption) and molar absorptivity (ε). For AP-level work, recognizing how conjugation and substituents shift λmax is most important.
Rules of Thumb
- More conjugation → longer wavelength (bathochromic shift) — visible as a move from UV toward visible light.
- Electron-donating groups (EDGs) attached to a conjugated system often increase absorption (red shift); electron-withdrawing groups (EWGs) can also shift absorption depending on the transition.
- Chromophores (e.g., C=O, C=C, aromatic rings) absorb in predictable regions; auxochromes (groups like −OH, −NH2) modify intensity and λmax.
Practical Example
Benzene absorbs in the UV near ~254 nm. Adding conjugated double bonds or aromatic substituents pushes the λmax to higher wavelengths. Carotenoids with extensive conjugation absorb in the visible region, which is why they appear orange or red.
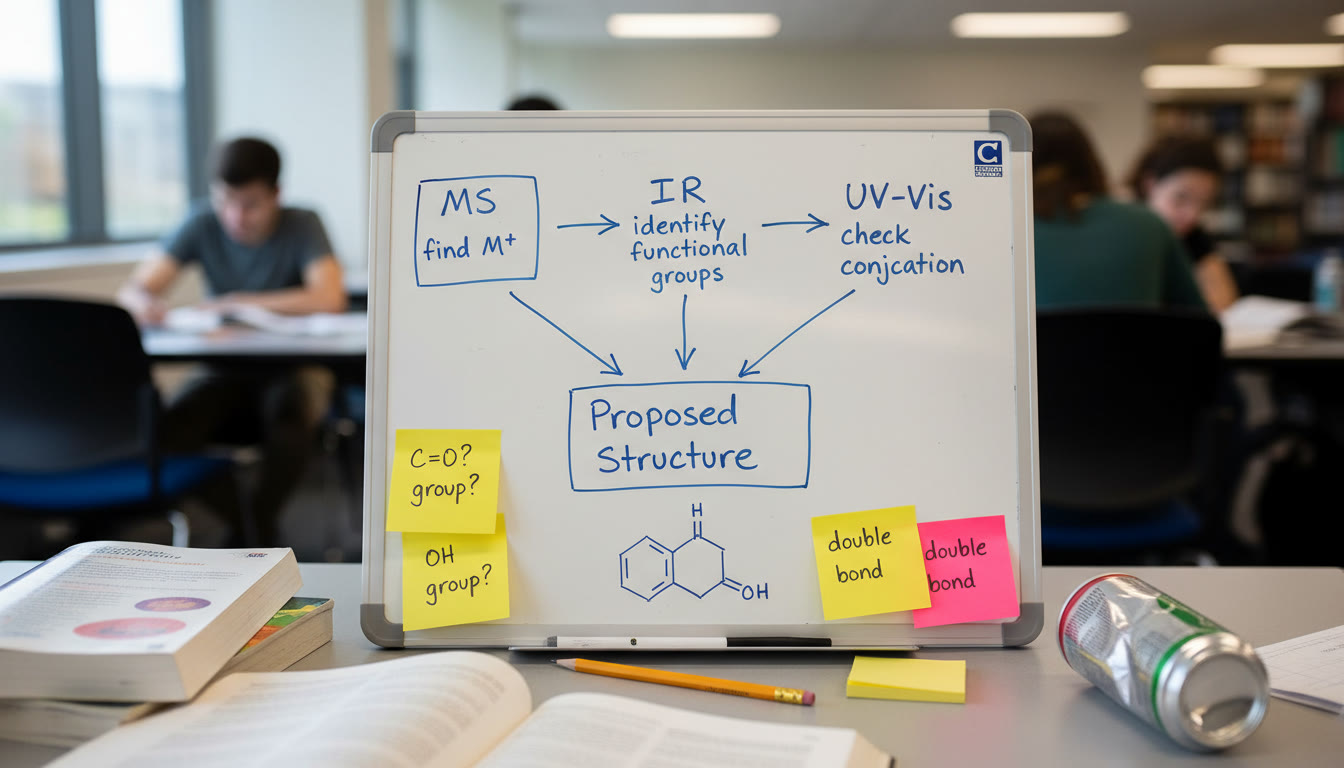
Putting the Techniques Together: A Stepwise Strategy
When you’re given IR, MS, and UV-Vis data for an unknown, use a logical sequence to build a structure instead of trying to interpret everything at once.
- Find the molecular weight (MS) — gives the target mass and elemental possibilities.
- Look for heteroatom clues (MS isotopes, IR) — Cl, Br patterns and IR O–H, N–H signals tell you which heteroatoms are present.
- Identify functional groups (IR) — carbonyls, alcohols, nitriles, etc., narrow down structural motifs.
- Confirm conjugation and electronic features (UV-Vis) — helps decide whether systems are conjugated or aromatic.
- Use MS fragments to place groups — fragmentation products show how the molecule can be logically split.
A Walk-Through Example
Suppose the MS shows M+ at m/z 150, the IR has a strong peak at 1705 cm−1 (carbonyl) and a broad band around 3100 cm−1 (O–H or N–H), and the UV-Vis shows an absorption at 275 nm. With MW = 150 and a carbonyl present, start considering possible CnHmO structures like aromatic ketones or carboxylic acids. If the IR O–H is broad but centered lower (2500–3300 cm−1), that suggests a carboxylic acid — combine that with MS fragments that indicate loss of 44 (CO2) being common for acids — and you narrow toward small aromatic carboxylic acids or aliphatic acids that fit MW 150.
Useful Reference Table: Spectral Features at a Glance
| Technique | Key Readout | What to Look For | Common Interpretations |
|---|---|---|---|
| IR | Wavenumber (cm−1) | Broad 3200–3600; Sharp 1700 | O–H broad; C=O strong → alcohol/acid and carbonyl |
| MS | m/z peaks | Molecular ion (M+), isotopic pattern | Molecular weight; presence of Cl or Br; fragmentation clues |
| UV-Vis | λmax (nm) | Shift to higher λ with conjugation | Extent of conjugation; chromophore identity |
AP-Specific Study Strategies
Practice Interpreting Full Sets of Data
AP questions often give a compact set of spectral data. Train by doing timed practice where you first list obvious observations (M+ value, strong IR peaks, λmax) and then propose 2–3 candidate structures. Check your work by asking: do the calculated masses and functional groups match every piece of data?
Memorize Patterns, Not Every Peak
You don’t need to memorize every possible wavenumber, but you should know the landmarks: O–H broad, C=O sharp, C≡N/C≡C sharp, aromatic patterns, and isotopic clues in MS. Make flashcards of common fragments (e.g., m/z 91 for benzyl/tropylium) and practice until they feel intuitive.
Use the Table as a Quick-Reference Card
Convert the earlier reference table into a single-page cheat-sheet you can quickly scan while studying. Write down the top 10 IR bands, top 8 MS fragment clues, and a few UV-Vis trends for conjugation. This condensed visual memory aid is especially helpful the night before a big exam.
Exam Tips: Save Time and Avoid Traps
- On multiple-choice, eliminate answers that contradict unambiguous spectral features first (e.g., if IR shows an O–H band, any answer lacking an O cannot be correct).
- Watch for trick wording that confuses functional group names versus structural isomers.
- If a molecular ion is absent or weak in MS (common for some ionization methods), rely more on fragments and IR evidence for molecular formula inference.
How to Practice Effectively (and Where Personalized Help Fits In)
Practice is not just repetition — it’s deliberate and varied. Mix short practice drills (identify the main IR peak, name the fragment) with longer synthesis problems (full structure elucidation). If you get stuck on patterns or need a study plan that targets weak spots, Sparkl’s personalized tutoring can be a game-changer. Tailored 1-on-1 guidance, expert tutors who craft targeted exercises, and AI-driven insights to show which topics need the most attention help convert confusion into clarity. Use tutoring sessions to review practice spectra and get feedback on reasoning, not just answers.
Common Student Mistakes and How to Avoid Them
- Relying on a single technique — combine IR, MS, and UV-Vis evidence before committing.
- Misreading isotopic patterns — remember Cl and Br have signature ratios that are easy to spot.
- Over-interpreting weak peaks — prioritize strong, reproducible signals.
- Forgetting context — always check molecular weight compatibility before assigning structures.
Mini Case Study: A Full Walkthrough (Step-by-Step)
Let’s solve a quick, realistic problem together. You’re given three pieces of data for an unknown organic compound:
- MS: prominent M+ at m/z 136, base peak at m/z 77.
- IR: strong peak at 1705 cm−1, aromatic C–H bands near 3030 cm−1.
- UV-Vis: λmax around 254 nm (consistent with aromatic systems).
Step 1 — Molecular weight: 136 suggests formula possibilities such as C8H8O2 (exact formula check would require additional calculation). Step 2 — IR carbonyl at 1705 cm−1 plus aromatic signals suggests an aromatic ketone or aromatic carboxylate. Step 3 — Base peak at m/z 77 is classic for phenyl/tropylium ion fragments from benzene-derived systems. Combine the three: an aromatic compound with a carbonyl — think about acetophenone-like structures or aromatic acids/esters that fit MW 136. With a little practice you’ll learn which exact substructures give which fragmentation patterns and intensities.
Study Resources and Practice Plan (Weekly, Focused)
Here’s a sample four-week plan to build spectral literacy, assuming you study 4–6 hours per week:
- Week 1: IR focus — memorize major bands, practice 20 IR-only questions, create a one-page IR cheat sheet.
- Week 2: MS focus — learn molecular ion and key fragments, do isotope-pattern drills, practice 20 MS interpretation problems.
- Week 3: UV-Vis and integration — study conjugation effects, do combined IR/MS/UV problems, create flowchart for structure elucidation.
- Week 4: Mixed practice and timed sets — full-spectrum problems under timed conditions, review weak points with flashcards or a tutor.
If you want study plans tailored to your schedule and strengths, Sparkl tutors can help craft one-on-one plans, provide feedback on your problem-solving steps, and use data-driven insights to adapt your practice in real time.
Final Thoughts — Make Spectra Your Favorite Puzzle
Spectroscopy is where chemistry feels like detective work: every bump in a spectrum has meaning, and with practice you’ll start seeing patterns instead of noise. Keep your study sessions active: sketch out why a peak appears, explain to a peer (or tutor) why a fragment is favored, and treat every practice problem as a mini-investigation. When you combine intuition from IR, MS, and UV-Vis, structure elucidation becomes less about memorizing and more about reasoning — and that’s exactly the kind of skill AP exams reward.

Quick Reference: Cheat Sheet You Can Copy
Here’s a compact checklist to keep handy when you practice or face AP-style questions:
- MS: Find M+ → note base peak → check isotopic patterns (Cl/Br).
- IR: Identify strong peaks (1700, broad 3200–3600) → assign likely functional groups.
- UV-Vis: Look for λmax shifts → ask if conjugation explains color/absorbance.
- Combine: Does the molecular weight allow the suggested composition? Do fragments match predicted cleavage points?
Want Extra Practice or Personalized Feedback?
If you enjoy feedback while solving spectra, consider a few targeted sessions with a tutor who can model thinking aloud as they interpret spectra, correct small misconceptions, and assign the right practice problems to fill gaps. Sparkl’s personalised tutoring and its combination of expert tutors and AI-driven insights can make your study time more efficient — helping you build confidence and precision for AP exam day.
Parting Encouragement
Spectroscopy looks intimidating at first, but it rewards pattern recognition and clear reasoning. With steady practice—useful cheat sheets, sample problems, and occasional targeted tutoring—you’ll find yourself not just answering questions correctly, but enjoying the sleuthing process. Keep at it, and let each spectrum teach you something new about how molecules behave.


No Comments
Leave a comment Cancel