
Why Turn Board Practicals into AP-Style Lab Reports?
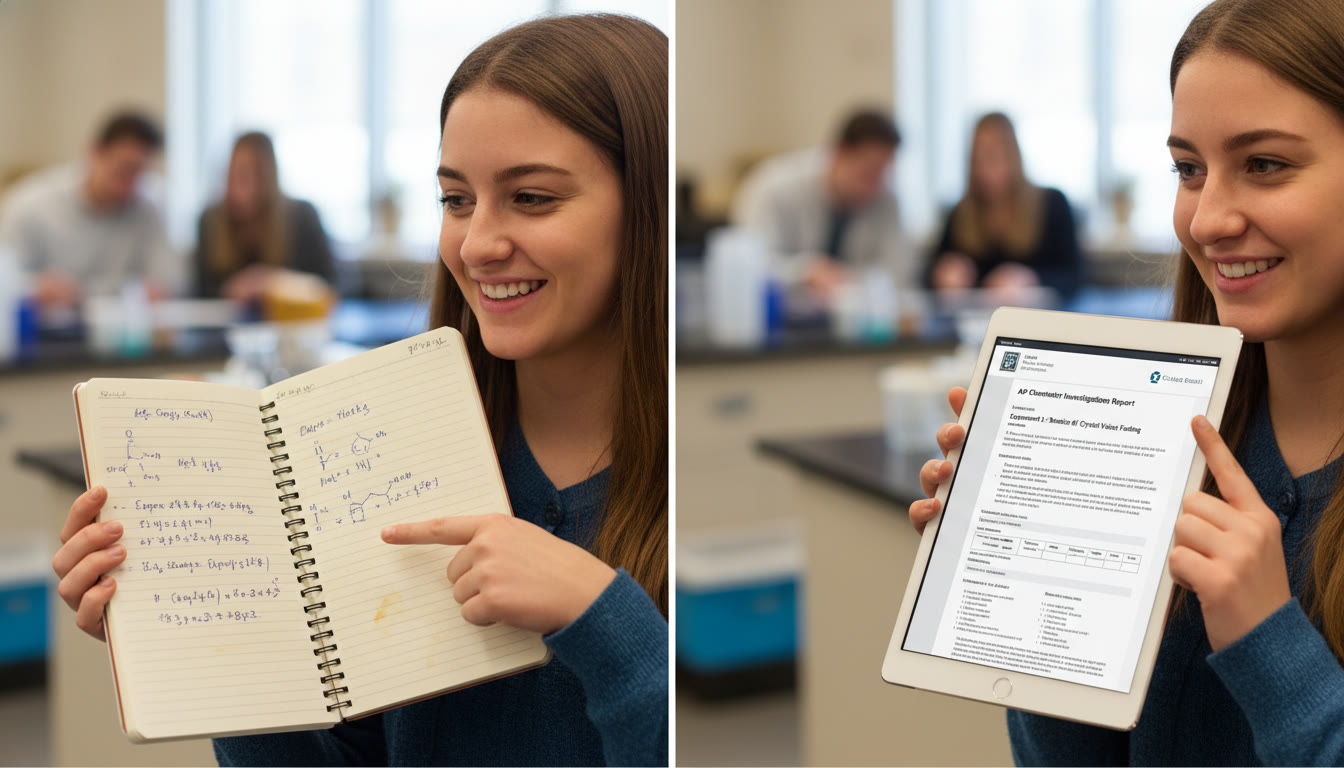
If you’re a student juggling school board practicals and the Advanced Placement (AP) curriculum, you’ve probably noticed an awkward mismatch: board practicals are often procedural checklists, while AP lab reports demand clarity, critical thinking, and a narrative that shows scientific reasoning. Learning to turn routine practicals into AP-style lab reports doesn’t just make your assignments look better — it trains you to think like a scientist and prepares you for the analytical writing and data interpretation that AP exams reward.
This guide walks you through the how and the why: step-by-step structure, concrete phrasing, sample language you can adapt, a table you can use to organize results, and study strategies to make the process repeatable. Where it fits naturally we’ll also mention how Sparkl’s personalized tutoring can help—especially if you want 1-on-1 guidance or tailored study plans that address your specific weak spots.
Understand the AP Lab-Report Mindset
AP-style lab reports prioritize evidence and explanation over rote description. Instead of listing steps you took, aim to do three things clearly: explain the question you sought to answer, show how your data supports a conclusion, and demonstrate awareness of limits and improvements.
Think of a lab report as an argument with evidence. The best AP reports present a clear claim (your conclusion), show the evidence (data and analysis), and defend the claim while acknowledging uncertainty or error. Writing this way prepares you for AP free-response questions and the skill of scientific reasoning — which exam scorers value highly.
Key Differences: Board Practicals vs AP Lab Reports
- Board Practicals: Step-by-step, checklist-driven, often graded on procedure and final number.
- AP Lab Reports: Interpretive, evaluation-focused, scored on clarity, reasoning, and correct use of data.
- Language: Board practicals use procedural verbs (measure, observe); AP reports use analytical verbs (suggest, indicate, imply).
- Format: Board reports may accept raw observations; AP reports require structured sections (question, hypothesis, method, data, analysis, conclusion, limitations).

AP-Style Lab Report Structure (A Practical Template)
Use this as your working template. Each section includes short tips and example phrasing you can adapt.
1. Title
Be specific and informative. Instead of “Experiment 5,” write “The Effect of Light Intensity on Photosynthetic Rate in Elodea Canadensis.” Keep it short but descriptive.
2. Research Question
Turn the experiment objective into a question. Example: “How does varying light intensity affect the rate of photosynthesis in Elodea Canadensis as measured by oxygen production?” Questions orient the reader and guide the hypothesis.
3. Hypothesis
State a clear, testable prediction and briefly include your rationale. Example: “If light intensity increases, then the rate of photosynthesis will increase up to a saturation point, because more photons will allow more photosystems to drive electron transport until another factor becomes limiting.” Keep the reasoning short and tied to basic theory.
4. Materials and Methods (Concise)
Write this so another student could reasonably reproduce the experiment. Use bullet points or numbered steps and include key variables and controls. For AP-style reports, focus less on minute procedural detail and more on variables, measurable outcomes, and sources of error.
- Independent variable: Light intensity (lux)
- Dependent variable: Rate of oxygen production (mL O2 per minute)
- Controls: Same species, temperature, CO2 source, and duration
5. Data Presentation
Present data clearly using tables and figures. Label everything, include units, and, when possible, show average values with error estimates. Here’s a simple table format you can adapt in your report.
| Light Intensity (lux) | Trial 1 (mL O2/min) | Trial 2 (mL O2/min) | Trial 3 (mL O2/min) | Average (mL O2/min) | Standard Deviation |
|---|---|---|---|---|---|
| 100 | 0.8 | 0.9 | 0.85 | 0.85 | 0.05 |
| 500 | 2.1 | 2.0 | 2.05 | 2.05 | 0.05 |
| 1000 | 3.0 | 2.9 | 3.1 | 3.0 | 0.10 |
After the table, briefly restate the main trend in one sentence: “Average oxygen production increased with light intensity from 100 to 1000 lux.” That prepares the reader for analysis.
6. Analysis and Interpretation
This is the heart of the AP-style report. Don’t just restate numbers — interpret them. Use clear, evidence-backed language:
- Identify trends: “Oxygen production increased with light intensity, suggesting light was limiting photosynthesis under lower intensities.”
- Use calculations where relevant: include percent change, rate comparisons, or simple regressions if appropriate.
- Relate back to core principles: “This supports the light-dependent reactions’ dependency on photon flux density.”
7. Conclusion
Summarize your claim succinctly and tie it back to the hypothesis. Example: “The data support the hypothesis that photosynthetic rate increases with light intensity up to 1000 lux under these conditions.” Keep the conclusion limited to what your data actually support.
8. Evaluation and Improvements
AP scorers look for honest evaluation. List specific limitations and suggest realistic improvements:
- Sources of error (timing in oxygen collection, variations in plant health, inconsistent light placement)
- Improvements (use a light meter for precise intensity, increase trial count, control temperature with a water bath)
- Further experiments (test higher intensities, test different species or CO2 levels)
Language and Phrasing That Scores
Small wording choices change the tone from descriptive to analytical. Here are switch phrases that make your report sound AP-ready:
- Instead of “we saw” → “the data indicate”
- Instead of “it worked” → “the results are consistent with”
- Instead of “maybe because” → “this trend may be explained by”
- When discussing uncertainty: “Possible systematic error includes…” or “Random variation is likely due to…”
Quick Examples: Before and After
Before (Board practical style): “We measured oxygen and found more oxygen at higher light. Temperature was same.”
After (AP style): “Average oxygen production increased with light intensity, rising from 0.85 to 3.0 mL O2/min across the tested range. These results support the hypothesis that light intensity was limiting photosynthetic rate under lower intensities; however, temperature control and variation in plant health could introduce systematic error.”
Practical Tips for Turning Each Board Practical Into an AP Report
Most board practicals follow a familiar rhythm. Use this checklist to transform them fast.
Checklist
- Convert the objective into a clear research question.
- Write a one-sentence hypothesis with a brief rationale referencing theory.
- Condense methods to highlight variables and reproducible steps.
- Record raw data carefully; compute averages and include uncertainty.
- Interpret: tie results to theory; don’t just restate numbers.
- Give two specific improvements and one related future experiment.
Time-Saving Strategies (When You’re Busy)
- Create templates for Materials, Methods, and Evaluation that you can reuse across experiments.
- Keep a digital log of raw data to speed table creation and calculations.
- Practice a few stock phrases that convey analysis without sounding canned.
Grading Focus: What AP Readers Look For
Although AP readers vary by subject, they commonly reward:
- Clear claim and evidence linkage
- Appropriate use of data and calculations
- Understanding of scientific principles
- Thoughtful evaluation of error and uncertainty
- Concise, precise writing
If you address these reliably, your lab work will be stronger in both classroom grading and AP-style assessment.
Sample Paragraph: Concise Analysis You Can Model
“The mean oxygen production increased monotonically with light intensity from 100 to 1000 lux (Table 1), indicating that light was a limiting factor in this range. The percent increase between 100 and 1000 lux was approximately 252%, which is consistent with the expected response of light-limited photosynthetic systems. However, the increase in standard deviation at 1000 lux suggests small inconsistencies in measurement technique or organismal condition. Implementing a calibrated light meter and increasing biological replicates would reduce uncertainty and clarify whether a saturation point exists above 1000 lux.”
Using Technology and Support: When to Get Help
Some aspects of turning practicals into AP reports are straightforward, but others—statistical treatment, error analysis, or linking results to deeper theory—can be tricky. That’s where targeted support can accelerate progress. Personalized tutoring like Sparkl’s 1-on-1 guidance can help you craft stronger hypotheses, set up controlled experiments, and refine your writing so it reflects AP-level reasoning. Tutors can also provide tailored study plans and AI-driven insights into common mistakes, helping you focus on the highest-impact improvements.
Practice Routine: A Weekly Plan to Improve Lab Writing
Make lab-report skill development a habit. Here’s a basic weekly routine you can adapt.
- Monday: Review theory related to an upcoming practical and write a practice hypothesis.
- Tuesday: Run the practical; focus on precise data collection.
- Wednesday: Create tables and draft the results paragraph.
- Thursday: Write the analysis and conclusion; identify two limitations.
- Friday: Peer review or tutor review — revise for clarity and concision.
Small, regular practice beats last-minute panic and builds a stronger scientific voice.
Common Mistakes and How to Avoid Them
- Mistake: Confusing observation with interpretation.
Fix: Separate raw results from your explanation; label sections clearly. - Mistake: Overstating conclusions beyond data.
Fix: Use qualifiers like “suggests” and stick to what the data actually show. - Mistake: Ignoring uncertainty.
Fix: Include an estimate of random error and a note about systematic sources. - Mistake: Poor table labeling.
Fix: Always include units and statistical measures when possible.
Final Thought: Turn Every Practical Into a Learning Opportunity
Board practicals are more than obligations — they’re a chance to practice scientific thinking. By converting them into AP-style lab reports, you sharpen skills that matter for exams, college lab courses, and real-world problem solving. Start by applying the template above to one practical, polish it, and compare before-and-after results. Over time you’ll notice not only better grades, but clearer thinking and more confidence in the lab.
If you want faster improvement, consider getting targeted help: a short series of sessions with a tutor can provide feedback on your reports, personalized study plans, and strategies to tighten your experimental design. Sparkl’s 1-on-1 tutoring and expert-led feedback can be a time-efficient way to level up when you have limited study hours.
Closing Checklist: Before You Submit
- Is the research question clear and stated early?
- Does the hypothesis include a brief rationale?
- Are variables and controls obvious in Methods?
- Are data presented with units, averages, and error estimates?
- Does the Analysis link evidence to your claim?
- Have you included two specific improvements and one follow-up experiment?
Write one report using this approach, get feedback, revise, and repeat. The ramp from a board practical to an AP-style lab report is not about doing different experiments — it’s about telling a clearer scientific story. When you tell that story well, your scores, confidence, and readiness for college-level science all rise together.
Good luck, and remember: the skill of turning raw experiment notes into tight, persuasive reports is one of the most valuable tools you’ll carry through AP exams and beyond.


No Comments
Leave a comment Cancel