What Percentiles Really Mean in SAT Scores
When you first open your SAT score report, that neat little number sitting next to “Percentile” can feel mysterious. Is a 75th percentile good? Is the 99th percentile the only one that matters? And how does the percentile relate to the 1400 (or 1200) staring back at you? If you’ve ever felt confused by percentiles, breathe easy: they’re simply a way to describe how you performed compared with other test takers. But like any tool, percentiles are most useful when you know how to read them and how to apply them to real choices—college lists, scholarship goals, and day-to-day study strategy.
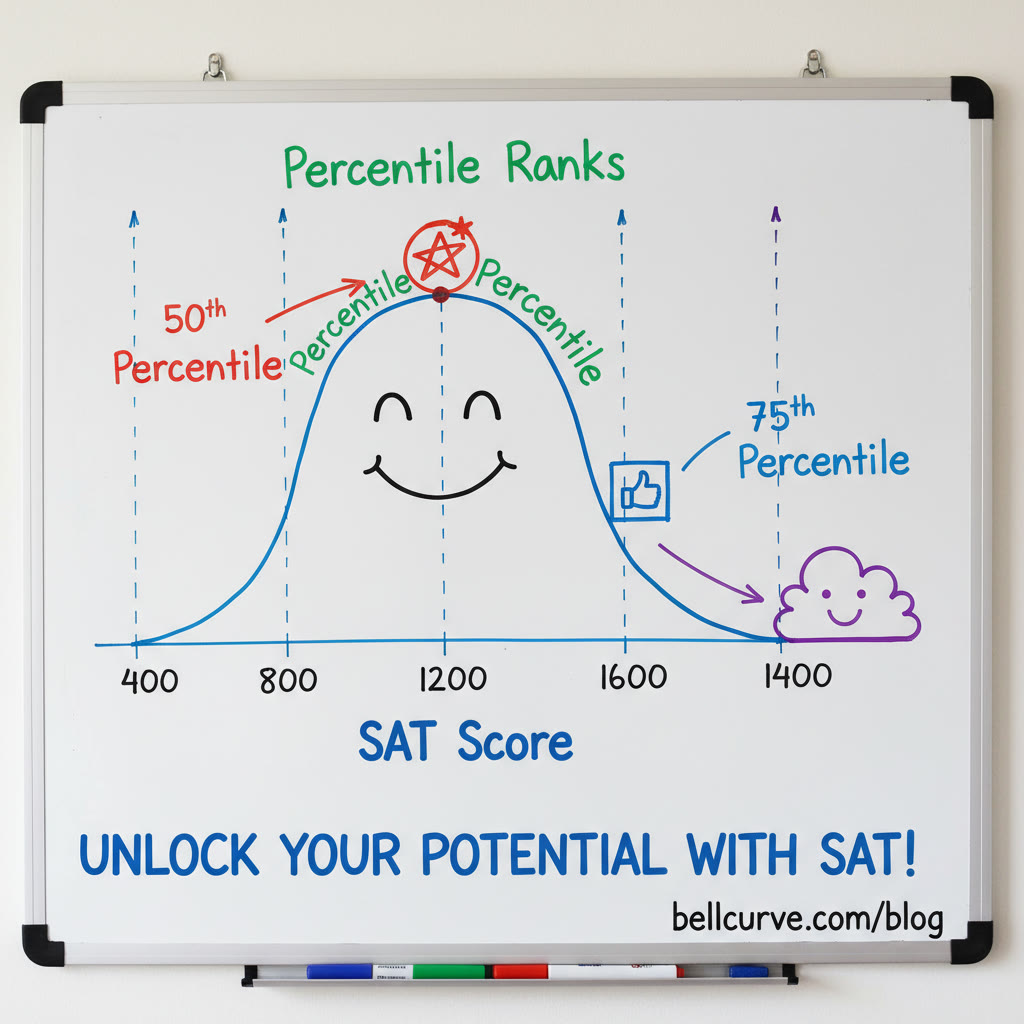
Understanding Percentiles: The Big Picture
A percentile tells you where you fall in a group. If your SAT percentile is 80, you scored as well as or better than 80% of students in the comparison group. It’s a ranking, not a percentage of questions you got right. That small distinction is important: percentiles are relational, not absolute. Two students could both correctly answer 60% of questions on two different test forms and end up with different percentiles if the relative difficulty or the performance of other students differs.
Percentile vs. Scaled Score vs. Raw Score
Let’s untangle three numbers you’ll see on score reports:
- Raw score — The number of questions you answered correctly (with a small penalty for certain older versions; modern SATs score right answers only). This is the most direct measure of how many items you answered correctly on a test form.
- Scaled score — The familiar 400–1600 total and 200–800 section scores. Raw scores are converted into scaled scores so that students who took different test forms can be compared fairly.
- Percentile — A rank that shows how your scaled score compares to a reference population (for example, the most recent cohort of U.S. test takers). It answers the question: “What percentage of students scored the same or worse than I did?”
Put simply: raw → scaled → percentile. Each step makes the score more interpretable for comparison.
How the SAT Percentiles Are Calculated
The College Board calculates percentiles by comparing a student’s scaled score to a reference group. Historically, that group has often been the cohort of U.S. high school graduates who took the SAT in recent years. Because cohorts shift and test forms are equated to maintain fairness, the percentiles can change slightly from year to year even if scaled scores stay constant.
Equating and the Reference Group
To be fair across different test administrations and slightly different questions, scores are “equated.” Equating aligns raw scores from one form of the test to scaled scores on another so that a 1300 (for example) means roughly the same level of ability no matter the form. Percentiles are then assigned by ranking those scaled scores within the reference population. Because the group of students who take the SAT can be slightly different each year (for reasons like test-optional policies or changing demographics), the mapping between scaled scores and percentiles is not fixed forever.
Why Percentiles Move Over Time
Imagine a year where more students aiming for selective colleges decide to take the SAT; the competition becomes slightly tougher and the percentile for a 1400 might dip a little. Conversely, if fewer students at the top end test in another year, a 1400 could correspond to a higher percentile. That’s why percentiles are best understood as context-dependent snapshots, not immutable facts.
What Common Percentiles Mean in Practical Terms
Percentiles are shorthand for how competitive you are. Here are practical interpretations you can use right away:
- 50th percentile: You’re exactly in the middle of the reference group—solid, but room to stand out if applying to competitive programs.
- 75th–85th percentile: You’re well above average. Many colleges view these scores favorably, depending on major and applicant pool.
- 90th–95th percentile: Strong applicant profile for competitive selective schools and merit scholarships.
- 99th percentile: Exceptional—you’re among the very top test takers nationwide.
Example: Approximate Score-to-Percentile Table
Below is a simple table to help you visualize how a scaled SAT score might map to an approximate percentile. Remember: these are illustrative, rounded numbers—the College Board’s published tables for a given year are the precise authority.
| Scaled SAT Score (Total, 400–1600) | Approximate Percentile |
|---|---|
| 1600 | 99+ |
| 1550 | 99 |
| 1500 | 98 |
| 1450 | 95–97 |
| 1400 | 93–94 |
| 1350 | 88–91 |
| 1300 | 83–86 |
| 1250 | 75–80 |
| 1200 | 68–74 |
| 1150 | 60–66 |
| 1100 | 53–58 |
| 1000 | 40–45 |
| 900 | 25–30 |
| 800 | 15–18 |
| 700 | 8–10 |
| 600 | 3–5 |
| 500 | 1–2 |
Note: Small changes in scaled score at different points on the curve can mean very different percentile jumps. Gaining 30 points near 1400 might move you fewer percentile points than a 30-point gain around 1000.
Section Percentiles: EBRW and Math
The SAT total score is the sum of two section scores: Evidence-Based Reading and Writing (EBRW) and Math, each 200–800. Percentiles are also reported for each section. Colleges sometimes look at section percentiles separately—for example, a math-heavy engineering program might care more about your Math percentile than your EBRW percentile.
- High EBRW and lower Math? That can push you toward humanities programs or suggest targeted math study.
- High Math and lower EBRW? Consider investing in reading fluency and grammar mechanics if your intended major values writing.
How Colleges and Scholarships Use Percentiles
Admissions offices don’t work off percentiles alone—they look at essays, GPA, recommendations, extracurriculars, and context. But percentiles are a quick filter. Many scholarship cutoffs are effectively percentile thresholds; scholarships that seek top 5% of applicants are looking for students roughly in the 95th percentile or above.
Remember that what matters is your standing relative to the pool of applicants to a particular college. A mid-Atlantic liberal arts college may have an applicant pool with different score distributions than a national research university, so percentiles provide general signals rather than hard-and-fast rules.
Using Percentiles to Set Realistic Goals
Percentiles are practical for goal-setting: they help you decide how ambitious your target score should be and where to focus effort. Here’s a simple process to convert percentiles into action:
- Decide a target percentile based on the schools or scholarships you’re aiming for.
- Find the scaled score that corresponds to that percentile (use the most recent College Board table or your test prep provider’s conversions).
- Assess the gap between your current scaled score and the target score in terms of raw improvements on practice tests—how many questions do you need to get right differently?
- Create a study plan that targets the weakest question types that block you from those gains.
For many students, moving from the 60th to the 80th percentile requires smarter study more than brute force—targeted practice, real-time feedback, and clear strategy. This is where personalized approaches shine. Programs that offer 1-on-1 guidance, tailored study plans, and expert tutors can help you prioritize the exact topics that will yield the biggest percentile jumps. Sparkl’s personalized tutoring, for example, pairs students with experienced tutors who translate percentile goals into step-by-step learning milestones and use AI-driven insights to track progress.
Common Misconceptions About Percentiles
- “Percentiles = percent correct.” Not true. Percentile is a rank among test takers, not the percentage of correct answers.
- “Higher percentile always means more questions correct by a fixed number.” Gains in percentile depend on where you are on the score distribution—small point changes at the top end may move your percentile less than the same change in the middle.
- “Percentiles are permanent.” No. Percentiles reflect a reference population and can change slightly over time.
- “A higher percentile guarantees admission.” Percentiles are one piece of a broader admissions picture.
Real-World Scenarios: Applying Percentile Thinking
Scenario 1: Jaime scored 1250 (mid-70s percentile) and wants to apply to selective liberal arts colleges where the median admitted student is around the 90th percentile. Jaime’s tutor breaks the target into specific wins: improving accuracy on medium-difficulty math problems, increasing reading speed to handle passages faster, and practicing SC (sentence correction) strategies. With focused practice and a simulated-test plan, Jaime raises the score to 1370, moving into the upper 80s percentile—a meaningful difference in admissions competitiveness.
Scenario 2: Priya is a junior aiming for a STEM program and has a 1450 total with a Math percentile in the mid-90s but an EBRW percentile near the 80th. Because the program values math, Priya’s strong Math percentile makes her competitive, but she decides to boost EBRW to be more well-rounded and to maximize scholarship opportunities. Priya’s tutor creates a targeted reading and writing regimen that shifts the EBRW percentile upward without losing Math momentum.
These stories show that percentiles help target where you should direct limited study time: build up your weaker section, or widen your competitive edge in your stronger section depending on your goals.

Tracking Progress: From Practice Tests to Test Day
Percentiles are especially useful when you track them over time. Instead of obsessing over a single practice test, build a trendline—are your percentiles improving across multiple tests? If your percentile jumps up and down wildly, focus on consistency: work on time management, test stamina, and targeted question types.
How Many Points Correspond to Percentile Gains?
There’s no single conversion, but here are some realistic examples to build intuition:
| Baseline Score | Example Improvement | Typical Percentile Change (Approx.) |
|---|---|---|
| 1000 | +50 points | ~6–10 percentile points |
| 1200 | +50 points | ~4–8 percentile points |
| 1400 | +30 points | ~1–3 percentile points |
| 1500 | +20 points | ~1–2 percentile points |
Why the difference? Because the score distribution is denser in the middle. If a lot of students cluster around 1200, a 50-point jump lifts you past many peers and your percentile climbs more. Near the top, fewer students exist, so the same point gain passes fewer peers.
Actionable tip: if your goal is to move percentiles efficiently, target question types that are high-yield for your score range—those that your data shows you frequently miss. Personalized tutors and platforms that analyze your mistakes can save you weeks of aimless practice. Sparkl’s 1-on-1 guidance and AI-driven insights, for example, help students identify those high-leverage gaps and build a tailored plan to convert practice into percentile growth.
Putting Percentiles into Your Study Routine
Here’s a compact routine that uses percentiles productively:
- Take an official practice test early to establish a baseline scaled score and percentile.
- Set a realistic percentile target based on your college list or scholarship goals.
- Create a study plan that focuses on the weakest areas affecting your score-band (e.g., time management, specific math topics, vocabulary in context).
- Retest every 4–6 weeks to measure percentile trends rather than obsessing over single-test volatility.
- Use tutors or focused resources for persistent weak spots—targeted instruction beats generic practice alone.
Final Thoughts: Use Percentiles Wisely—They’re a Compass, Not a Command
Percentiles are an elegant, powerful shorthand for where you stand compared to other test takers. They help with realistic goal-setting, with prioritizing study, and with understanding the stakes for admission and scholarships. But they’re only part of the picture. Colleges look for character, curiosity, resilience, and fit—so treat percentiles as a compass to guide your journey, not as the entire map.
If you want to convert percentile insights into smarter practice, consider a personalized approach: targeted feedback, a tailored study plan, and consistent progress monitoring. Many students find that working with a tutor turns confusing percentile movements into a clear plan. Sparkl’s personalized tutoring emphasizes one-on-one guidance, expert tutors, and AI-driven insights that translate percentiles into specific learning steps—helping you turn small, strategic improvements into big jumps in competitiveness.
Remember: percentiles tell you where you are today. With deliberate practice and smart strategy, you can decide where you want to be tomorrow.
Next Steps
Take a practice test, note your percentile, and set one small action for the week—maybe 30 minutes a day focused on a single question type that costs you points. Track your percentile across tests and celebrate incremental wins. Those small, consistent moves are what convert percentile awareness into real score improvement.


No Comments
Leave a comment Cancel