Why Experimental Design Matters — and Why You Should Care
If you’ve ever watched a science show and thought, “Cool — but how do they actually know that?” you were peeking at the heart of experimental design. Whether you’re prepping for AP Biology, AP Chemistry, AP Physics, or AP Psychology, designing clean experiments is where observation meets reasoning. In short: it’s how scientists turn curiosity into evidence.
This guide walks you through the nuts and bolts — independent and dependent variables, controls, common sources of error, and strategies to keep your investigations sharp and exam-ready. Expect practical examples, helpful visuals, and study tips for exam season. And if you want 1-on-1 help building your lab intuition, Sparkl’s personalized tutoring can give you targeted guidance and tailored study plans to strengthen the exact skills AP exams test.
Start Here: The Building Blocks of an Experiment
The Scientific Question
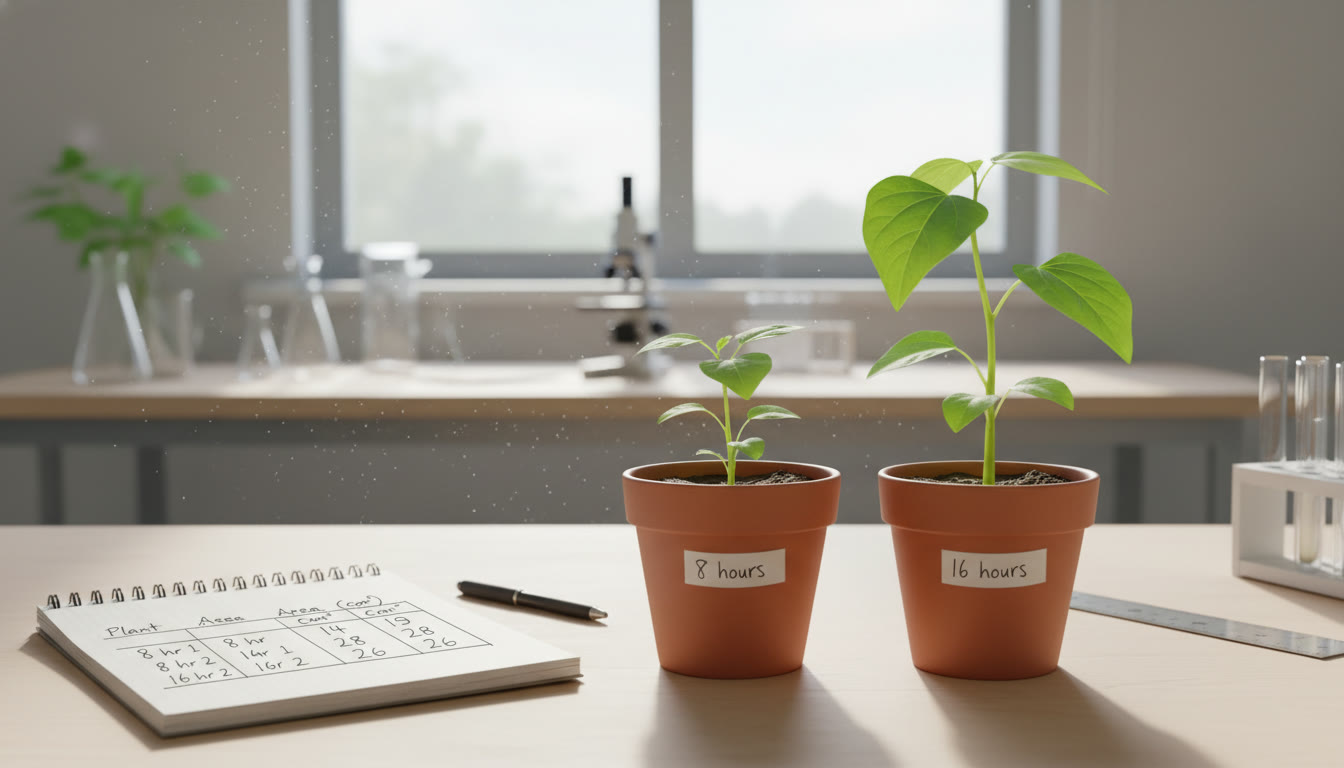
Every solid experiment begins with a clear, testable question. Vague questions lead to messy investigations. A good scientific question is precise and measurable. For example:
- Weak: “Does light affect plants?”
- Strong: “How does exposing Arabidopsis thaliana to 8 hours versus 16 hours of light per day affect mean leaf area after four weeks?”
See the difference? The strong question defines the subject, the manipulated condition, the measured outcome, and the timeframe.
Variables: The Pieces You Move and Measure
Understanding variables is the single most important skill in experimental design. There are three primary types:
- Independent Variable (IV): The thing you change intentionally. In the plant example, light duration (8 vs. 16 hours).
- Dependent Variable (DV): What you measure — the outcome that responds to the IV. Here, mean leaf area after four weeks.
- Controlled Variables (Constants): Everything you keep the same so only the IV can explain differences in the DV: soil type, water volume, temperature, pot size, seed source, and so on.
AP exams reward clarity: when you write up an experiment, explicitly label the IV, DV, and controlled variables. Teachers and graders want to see that you can separate what you changed from what you measured.
Controls: The Anchor of Valid Results
Controls are often misunderstood. A control group or control condition provides a baseline — a standard to compare against. There are two common uses:
- Negative Control: Expected to produce no effect (shows that the experimental setup doesn’t produce false positives). For example, if you test an enzyme’s activity, a negative control might be boiled enzyme to ensure activity disappears when the enzyme is denatured.
- Positive Control: Expected to produce a known effect (shows the setup can detect an effect when it should). Using a well-characterized catalyst that increases reaction rate would be a positive control.
Good experiments use controls to rule out alternative explanations. Without them, it’s easy to misattribute cause and effect.

Design Tip: Think About Replication and Sample Size
Replication reduces the role of random chance. If only one plant in each light condition is measured, differences might just be due to chance or an outlier. Use multiple replicates — ideally at least three, and when possible, many more — to capture variation and support statistical tests.
Sample size matters: small samples are noisier and make it harder to detect true effects. AP-level investigations won’t always let you run huge samples, but show you understand the principle and, where appropriate, include rationale for your chosen sample size.
Blocking and Randomization
Two techniques help control variability not tied to your IV:
- Randomization: Assign samples to treatments randomly to prevent systematic biases (e.g., plants placed on different shelves where one shelf gets more sunlight).
- Blocking: Group similar experimental units and randomize within blocks to reduce known sources of variation (e.g., block by batch of seeds or by shelf).
When you describe an experiment on an AP test or lab report, briefly note any randomization or blocking you used — graders reward awareness of real-world variability.
Common Sources of Error (and How to Tame Them)
No experiment is perfect. Errors fall into two big buckets: systematic and random. Knowing the difference helps you diagnose problems and propose fixes — a skill AP scorers love.
Random Error (Noise)
Random error stems from unpredictable fluctuations: tiny differences in measurement technique, slight temperature swings, or biological variation. You can’t eliminate all random error, but you can reduce its effect:
- Increase sample size to average out noise.
- Use precise instruments and consistent measurement protocols.
- Report variability with statistical measures (standard deviation, standard error) when possible.
Systematic Error (Bias)
Systematic errors shift measurements consistently in one direction: a miscalibrated scale, a ruler where the zero is off, or an assay that consistently underestimates concentration. These are dangerous because they can produce confident but wrong conclusions.
How to address systematic error:
- Calibrate instruments against standards.
- Run controls (positive and negative) to reveal biases.
- Blind measurements when subjective judgment is involved (e.g., scoring behavior in animals).
Human Error and Procedural Drift
Humans are fallible: fatigue, sloppy labeling, or inconsistent timing can introduce error. Standard operating procedures, checklists, and practice runs are your friends. If you’re running an AP investigative lab, take careful notes and date-stamp protocols so you can reproduce methods consistently.
Data Presentation: Turning Numbers Into Insight
Collecting data is only half the battle — you must present it clearly so patterns reveal themselves. Tables and figures are the clearest way to communicate results on an exam or lab report.
Example Table: Plant Growth Under Two Light Regimes
| Replicate | Mean Leaf Area (mm²) — 8 Hours Light | Mean Leaf Area (mm²) — 16 Hours Light |
|---|---|---|
| 1 | 42.1 | 61.5 |
| 2 | 39.8 | 58.9 |
| 3 | 41.5 | 63.2 |
| Mean | 41.1 | 61.2 |
| Standard Deviation | 1.2 | 2.2 |
This simple table highlights central tendency and spread. On an AP exam you might be asked to interpret such data: compare means, comment on variability, and suggest whether differences are meaningful — ideally with statistical language or mention of hypothesis testing when appropriate.
Graphs That Tell a Story
Bar graphs with error bars, scatter plots, and line graphs are common ways to visualize data. Use axis labels with units, include error bars when possible, and avoid clutter. The visual should make your conclusion obvious before you even write it down.
Interpreting Results: From Data to Conclusion
When you interpret an experiment, move through these steps in your write-up or exam response:
- Summarize the pattern in plain language (e.g., “Plants under 16-hour light had larger mean leaf areas than plants under 8-hour light.”).
- Consider variability and whether the difference is likely meaningful (mention sample size, standard deviation, or the need for statistical tests).
- Connect back to biological or physical principles to explain why the IV might have caused the change in the DV.
- Address alternative explanations and limitations.
Explicitly acknowledging limitations is not a weakness — it shows maturity as a scientist. Good limitations to mention include small sample size, potential confounding variables you couldn’t fully control, or measurement precision.
Designing Strong AP-Style Investigations
AP exams often ask you to propose or critique experimental designs. Practice thinking like a grader: be concise, specific, and practical. Here’s a checklist you can use in your head or on paper during the test:
- State a clear hypothesis and corresponding IV and DV.
- List controlled variables explicitly.
- Include an appropriate control group (positive or negative as needed).
- Explain sample size and replication.
- Describe randomization or blocking if relevant.
- Note statistical methods you would use to analyze data (t-test, chi-square, ANOVA) or state that you would compare means with an appropriate test.
- Describe potential errors and how you would mitigate them.
AP-Friendly Example: Testing Reaction Rate
Imagine an AP Chemistry prompt: design an experiment to test how temperature affects the rate of an enzymatic reaction.
- IV: Temperature (e.g., 10°C, 20°C, 30°C, 40°C)
- DV: Reaction rate measured as change in absorbance per minute
- Controls: Enzyme concentration, substrate concentration, pH, cuvette volume, and instrument calibration
- Replication: Three replicates per temperature
- Controls/Standards: Negative control with denatured enzyme; positive control with a known active enzyme at optimal temperature
- Analysis: Graph reaction rate vs. temperature, discuss the likely presence of an optimum temperature, and acknowledge denaturation at high temperatures as a systematic effect.
A clear plan like this, with attention to controls and sources of error, will score well on AP prompts.
Common AP Mistakes and How to Avoid Them
Students often lose easy points by making avoidable errors. Here’s what to watch for:
- Mixing up IV and DV: Practicing labeling exercises helps. Always ask: “What am I changing?” versus “What am I measuring?”
- Neglecting controls: Describe both positive and negative controls when relevant.
- Forgetting units: Units are essential. Include them everywhere — tables, axes, written answers.
- Vague protocol steps: On AP questions, avoid “do X for some time.” Be specific: “incubate at 37°C for 10 minutes.”
- No discussion of error: If you don’t address sources of error and how to mitigate them, you miss a chance to show scientific thinking.
How to Practice — Strategies That Actually Work
Practice should be deliberate. It’s not about doing dozens of random labs but about focusing on weak spots and reflecting on design choices. Here are targeted practice strategies:
- Rewrite past AP free-response prompts: Create a compact experimental plan that hits all checklist items and compare it to model answers.
- Peer review: Swap designs with a classmate and critique each other’s controls and sources of error.
- Mock practicals: Time yourself and write a full experiment including a table and a brief analysis. Then score it against a rubric.
- Use a tutor or mentor: Personalized help can highlight subtle mistakes you repeat. Sparkl’s personalized tutoring offers expert tutors and AI-driven insights to identify recurring gaps and provide tailored study plans — useful when you need targeted, efficient progress.
Real-World Context: Why Experimental Rigor Matters Beyond the Exam
Experimental design isn’t just a test skill. It’s how we make decisions in medicine, engineering, and public policy. Flawed experiments can lead to wasted resources, bad policies, or dangerous treatments. Conversely, careful design fuels breakthroughs — from new drugs to clean energy solutions.
When you practice solid controls, proper replication, and transparent reporting, you’re building habits that matter whether you pursue science professionally or simply want to think more clearly about evidence in everyday life.

Quick Reference: Checklist for an AP Experimental Answer
| Item | What to Include |
|---|---|
| Hypothesis | Clear, testable statement linking IV to DV |
| Independent Variable | State levels and units |
| Dependent Variable | State measurement method and units |
| Controls | List constants, positive/negative controls |
| Replication | Number of replicates and rationale |
| Randomization/Blocking | Describe how you’ll reduce bias |
| Data Analysis | Describe graphs, statistical tests, and error reporting |
| Sources of Error | Identify likely errors and propose fixes |
When You’re Stuck: Simple Moves That Improve Any Design
If time is limited during a test or lab, use these high-impact fixes:
- Specify at least one control (even if you can’t run it): showing you understand controls counts.
- List three controlled variables — graders like explicit detail.
- Mention replication (“n = 3”) and justify briefly if small.
- Note one realistic source of error and one practical mitigation.
Those small moves often turn an incomplete-sounding answer into a complete and credit-worthy one.
Study Plan: Two Weeks to Sharper Experimental Reasoning
If you’re short on time before an AP exam or practical assessment, here’s a focused two-week plan to sharpen your experimental reasoning.
- Days 1–3: Review definitions and practice labeling IV/DV/controls on 10 short prompts. Time yourself. Aim for clarity under pressure.
- Days 4–6: Work through three full AP free-response prompts. Use the checklist to structure answers. Compare with model solutions where available.
- Days 7–9: Design mini-experiments from everyday observations (coffee cooling, plant growth, yeast respiration). Write tables, sketch graphs, and list errors.
- Days 10–12: Do peer review or meet a tutor for targeted feedback. Practice revising a weak design into a strong one.
- Day 13–14: Take two timed mock responses and review mistakes. Memorize the checklist. Practice explaining one experiment out loud in under three minutes.
Personalized tutoring can accelerate this process by focusing on the exact areas you struggle with. Platforms like Sparkl deliver tailored study plans and expert tutors who can help you correct persistent misconceptions quickly.
Final Thoughts: Be Curious, Be Precise
Experimental design is part art, part procedure. You need curiosity to ask interesting questions and precision to test them properly. On AP exams, clarity and structure matter as much as scientific insight. Always label your variables, justify your choices, include controls, acknowledge errors, and present data clearly.
Practice deliberately, use checklists, and when in doubt, explain your thinking. Showing a grader that you thought through potential confounders and sources of error can turn a tentative conclusion into a convincing one. And if you want customized practice or targeted feedback, Sparkl’s personalized tutoring can match you with expert tutors and AI-driven insights to help you build confidence and improve fast.
Resources for Continued Practice
Make a habit of analyzing experimental setups in papers, textbooks, or class labs. Ask: What would I change? What are the biggest weaknesses? How would I test them? Over time, this reflex will improve both your exam performance and your real-world scientific thinking.
Keep Going
Experimental design is a skill you build with disciplined practice and reflection. Start with clarity, control what you can, and learn from every mistake. You’ll not only be ready for AP exams — you’ll be thinking like a scientist.
Good luck — and remember: the best experiments are the ones you can explain clearly and reproduce reliably. Try designing one this week and write it up using the checklist above. You’ll be surprised how quickly your skills grow.


No Comments
Leave a comment Cancel